Square Enix 2009 Annual Report Download - page 49
Download and view the complete annual report
Please find page 49 of the 2009 Square Enix annual report below. You can navigate through the pages in the report by either clicking on the pages listed below, or by using the keyword search tool below to find specific information within the annual report.-
 1
1 -
2
-
3
-
4
-
5
-
6
-
7
-
8
-
9
-
10
-
11
-
12
-
13
-
14
-
15
-
16
-
17
-
18
-
19
-
20
-
21
-
22
-
23
-
24
-
25
-
26
-
27
-
28
-
29
-
30
-
31
-
32
-
33
-
34
-
35
-
36
-
37
-
38
-
 39
39 -
 40
40 -
 41
41 -
 42
42 -
 43
43 -
 44
44 -
 45
45 -
 46
46 -
 47
47 -
 48
48 -
 49
49 -
 50
50 -
 51
51 -
 52
52 -
 53
53 -
 54
54 -
 55
55 -
 56
56 -
 57
57 -
 58
58 -
 59
59 -
60
 |
 |

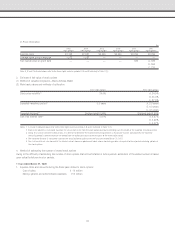
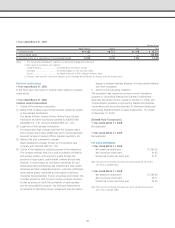
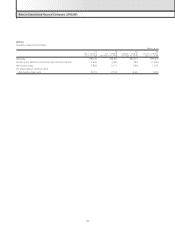
• Year ended March 31, 2009
Millions of yen
Games Games Mobile Phone Eliminations or Consolidated
(Offline) (Online) Content Publication Amusement Others Total unallocated total
I Sales and operating income
Net sales
(1) Sales to external customers ¥36,340 ¥10,580 ¥7,078 ¥12,984 ¥56,620 ¥12,088 ¥135,693 ¥ — ¥135,693
(2) Intersegment sales 2 48 13 0 1,648 281 1,996 (1,996) —
Total 36,343 10,629 7,092 12,985 58,269 12,370 137,690 (1,996) 135,963
Operating expenses 32,180 7,541 3,403 9,444 59,214 9,104 120,888 2,527 123,415
Operating income (loss) ¥ 4,162 ¥ 3,087 ¥3,689 ¥ 3,540 ¥ (944) ¥ 3,266 ¥ 16,801 ¥ (4,523) ¥ 12,277
II Total assets, depreciation and
amortization, impairment loss
and capital expenditures
Total assets ¥38,320 ¥10,325 ¥3,452 ¥ 9,074 ¥57,927 ¥12,699 ¥131,799 ¥81,394 ¥213,194
Depreciation and amortization 485 375 20 13 4,741 666 6,301 676 6,978
Impairment loss — — — — 766 — 766 92 859
Capital expenditures 297 177 1 2 10,663 1,417 12,559 572 13,131
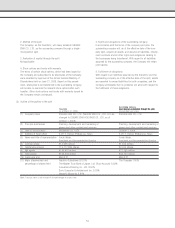
Notes: 1. The classification of business segments is made based on the types of products and services.
2. Major products offered by business segment are summarized as follows:
Segment Major Products
Games (Offline) Games
Games (Online) Online games
Mobile Phone Content Content for mobile phones
Publication Magazine comics, serial comics, game-related books
Amusement All businesses of the Taito Group including Amusement Operations and Rental,
Sales of Goods and Merchandise and Content Services
Others Derivative products such as character merchandise, school for game designers
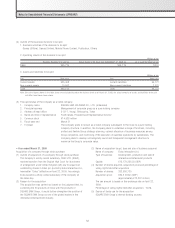
3. Unallocated operating expenses included in “Eliminations or unallocated” totaled ¥5,336 million. These expenses were related to administrative departments of the
Company which provide services and operational support that cannot be allocated to specific business segments.
4. Unallocated assets included in “Eliminations or unallocated” totaled ¥82,368 million. These assets mainly consisted of cash and deposits, deferred tax assets and
buildings and structures of administrative departments of the Company.
5. As noted in New Accounting Standard (Inventories), effective from the fiscal year ended March 31, 2009, the Company has applied “Accounting Standard for
Measurement of Inventories” (ASBJ Statement No. 9, issued on July 5, 2006). As a result of this change, operating income decreased for “Games (Offline)” by ¥42
million, for “Games (Online)” by ¥24 million and for “Amusement” by ¥618 million compared with the previous method.
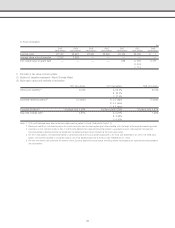
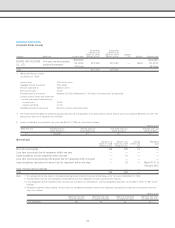
[Consolidated Geographic Segment Information]
• Year ended March 31, 2008
Millions of yen
North Eliminations or Consolidated
Japan America Europe Asia Total unallocated total
I Sales and operating income
Net sales
(1) Sales to external customers ¥127,643 ¥12,035 ¥7,217 ¥ 620 ¥147,516 ¥ — ¥147,516
(2) Intersegment sales 5,738 552 457 7 6,756 (6,756) —
Total 133,381 12,588 7,674 628 154,273 (6,756) 147,516
Operating expenses 115,069 9,836 6,592 1,222 132,721 (6,725) 125,996
Operating income (loss) 18,312 2,751 1,081 (594) 21,551 (31) 21,520
II Total assets ¥202,922 ¥12,387 ¥4,804 ¥1,825 ¥221,939 ¥(9,804) ¥212,134
Notes: 1. The classification of geographic segments is made based on geographical distance.
2. Main countries included in each segment:
(1) North America .......................... the United States of America
(2) Europe .................................... the United Kingdom
(3) Asia ........................................ the People’s Republic of China, Republic of Korea
47