Square Enix 2009 Annual Report Download - page 35
Download and view the complete annual report
Please find page 35 of the 2009 Square Enix annual report below. You can navigate through the pages in the report by either clicking on the pages listed below, or by using the keyword search tool below to find specific information within the annual report.-
 1
1 -
2
-
3
-
4
-
5
-
6
-
7
-
8
-
9
-
10
-
11
-
12
-
13
-
14
-
15
-
16
-
17
-
18
-
19
-
20
-
21
-
22
-
23
-
24
-
 25
25 -
 26
26 -
 27
27 -
 28
28 -
 29
29 -
 30
30 -
 31
31 -
 32
32 -
 33
33 -
 34
34 -
 35
35 -
 36
36 -
 37
37 -
 38
38 -
 39
39 -
 40
40 -
 41
41 -
 42
42 -
 43
43 -
 44
44 -
 45
45 -
46
-
47
-
48
-
49
-
50
-
51
-
52
-
53
-
54
-
55
-
56
-
57
-
58
-
59
-
60
 |
 |

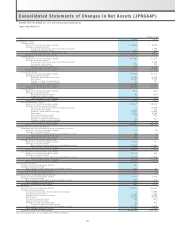
presented in the fiscal year ended March 31, 2008. Those two items
were “change due to increase in consolidation,” which amounted to
¥(63) million, and “increase in retained earnings due to exclusion of
subsidiaries from the scope of consolidation,” which amounted to
¥731 million, in the fiscal year ended March 31, 2008. In the fiscal
year ended March 31, 2009, “increase in retained earnings due to
exclusion of subsidiaries from the scope of consolidation” amounted
to ¥16 million.
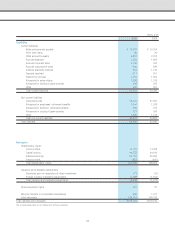
Notes to Consolidated Balance Sheets
• Year ended March 31, 2008
*1 Investments in non-consolidated subsidiaries and affiliates:
Investments and other assets ¥173 million
*2 Contingent liabilities for guarantees:
The Company’s consolidated subsidiary, TAITO CORPORATION,
has issued a guarantee of ¥1 million covering its lease obligations
to Diamond Asset Finance Co., Ltd., one of the Company’s sales
partners.
• Year ended March 31, 2009
*1 Investments in non-consolidated subsidiaries and affiliates:
Investments and other assets ¥127 million
*2 Contingent liabilities for guarantees:
Not applicable
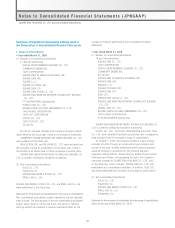
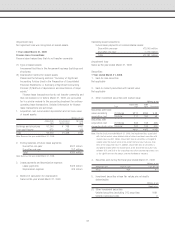
Notes to Consolidated Statements of Income
• Year ended March 31, 2008
*1 Not applicable
*2 Selling, general and administrative
expenses include R&D costs of ¥1,581 million
*3 Breakdown of loss on sale of property and equipment
Tools and fixtures ¥145 million
*4 Breakdown of loss on disposal of property and equipment
Buildings and structures ¥ 62 million
Tools and fixtures 131 million
Amusement equipment 741 million
Other 15 million
Total ¥950 million
*5 Loss on revaluation of investment securities was due to a
significant decline in market prices of marketable securities.
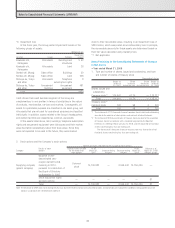
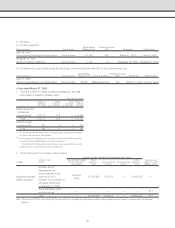
*6 Impairment loss
In this fiscal year, the Group posted impairment losses on the
following asset group:
Millions of yen
Impairment
Location Usage Category amount
Shibuya-ku, Tokyo Idle assets Telephone ¥9
and other subscription rights
Total ¥9
Cash inflows from business segments of the Group are complementary
to one another in terms of similarities in the nature of products,
merchandise, services and markets. Consequently, all assets for
operational purposes are classified in one asset group, and idle
assets which are not used for operational purposes are classified
individually. In addition, assets related to the Group’s headquarters
and welfare facilities are classified as common-use assets.
Telephone subscription rights in the above table were idle assets
and their market value fell substantially below their respective book
value. Since they were not expected to be used in the future, they
were marked down to their respective recoverable value, resulting
in an impairment loss of ¥9 million, which was posted as an
extraordinary loss.
In principle, the recoverable amounts for these assets are
determined based on their respective fair value calculated using
market prices.
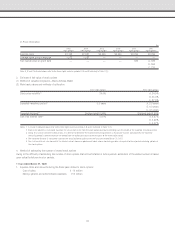
*7 A breakdown of loss on disposal and write-downs of assets
associated with business restructuring is as follows:
Inventories ¥ 658 million
Current assets 249 million
Other 394 million
Total ¥1,302 million
• Year ended March 31, 2009
*1 Inventories at fiscal year-end are stated after writing down
inventory based on its decrease in profitability. The following
amount is included within cost of sales as loss on valuation of
inventories ¥5,368 million
*2 Selling, general and administrative expenses include research
and development expenses of ¥1,525 million
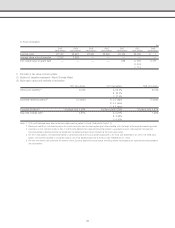
*3 Breakdown of loss on sale of property and equipment
Tools and fixtures ¥ 7 million
Amusement equipment 19 million
Total ¥26 million
*4 Breakdown of loss on disposal of property and equipment
Buildings and structures ¥102 million
Tools and fixtures 216 million
Amusement equipment 342 million
Software 9 million
Other 118 million
Total ¥790 million
*5 Same as the year ended March 31, 2008
33