Square Enix 2009 Annual Report Download - page 3
Download and view the complete annual report
Please find page 3 of the 2009 Square Enix annual report below. You can navigate through the pages in the report by either clicking on the pages listed below, or by using the keyword search tool below to find specific information within the annual report.-
 1
1 -
 2
2 -
 3
3 -
 4
4 -
 5
5 -
 6
6 -
 7
7 -
 8
8 -
 9
9 -
 10
10 -
 11
11 -
 12
12 -
 13
13 -
 14
14 -
15
-
16
-
17
-
18
-
19
-
20
-
21
-
22
-
23
-
24
-
25
-
26
-
27
-
28
-
29
-
30
-
31
-
32
-
33
-
34
-
35
-
36
-
37
-
38
-
39
-
40
-
41
-
42
-
43
-
44
-
45
-
46
-
47
-
48
-
49
-
50
-
51
-
52
-
53
-
54
-
55
-
56
-
57
-
58
-
59
-
60
 |
 |

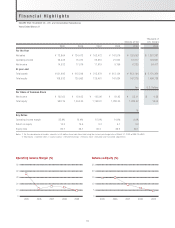
Financial Highlights
SQUARE ENIX HOLDINGS CO., LTD. and Consolidated Subsidiaries
Years Ended March 31
2005 2006 2007 2008 2009 2009
For the Year
Net sales ¥ 73,864 ¥ 124,473 ¥ 163,472 ¥ 147,516 ¥ 135,693 $ 1,381,387
Operating income 26,438 15,470 25,916 21,520 12,277 124,991
Net income 14,932 17,076 11,619 9,196 6,333 64,477
At year-end
Total assets ¥131,695 ¥ 213,348 ¥ 215,679 ¥ 212,134 ¥ 213,194 $ 2,170,360
Total equity 108,933 120,993 129,461 147,034 147,318 1,499,728
Yen U.S. Dollars
Per Share of Common Stock
Net income ¥ 135.63 ¥ 154.65 ¥ 105.06 ¥ 81.85 ¥ 55.11 $ 0.56
Total equity 988.19 1,094.50 1,168.91 1,280.50 1,280.92 13.04
%
Key Ratios
Operating income margin 35.8% 12.4% 15.9% 14.6% 9.0%
Return on equity 14.5 14.9 9.3 6.7 4.3
Equity ratio 82.7 56.7 60.0 69.3 69.1
Operating Income Margin (%) Return on Equity (%)
50
40
30
20
10
0
20092005 2006 2007 2008
25
20
15
10
5
0
20092005 2006 2007 2008
Notes: 1. For the convenience of readers, amounts in U.S. dollars have been translated using the currency exchange rates at March 31, 2009 of ¥98.23=US$1.
2. Total equity = Common stock + Capital surplus + Retained earnings + Treasury stock + Valuation and translation adjustments
Thousand of
U.S. DollarsMillions of Yen
01