Square Enix 2009 Annual Report Download - page 11
Download and view the complete annual report
Please find page 11 of the 2009 Square Enix annual report below. You can navigate through the pages in the report by either clicking on the pages listed below, or by using the keyword search tool below to find specific information within the annual report.-
 1
1 -
 2
2 -
 3
3 -
 4
4 -
 5
5 -
 6
6 -
 7
7 -
 8
8 -
 9
9 -
 10
10 -
 11
11 -
 12
12 -
 13
13 -
 14
14 -
 15
15 -
 16
16 -
 17
17 -
 18
18 -
 19
19 -
 20
20 -
 21
21 -
 22
22 -
23
-
24
-
25
-
26
-
27
-
28
-
29
-
30
-
31
-
32
-
33
-
34
-
35
-
36
-
37
-
38
-
39
-
40
-
41
-
42
-
43
-
44
-
45
-
46
-
47
-
48
-
49
-
50
-
51
-
52
-
53
-
54
-
55
-
56
-
57
-
58
-
59
-
60
 |
 |
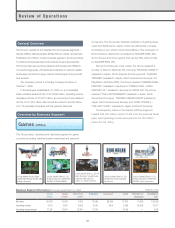
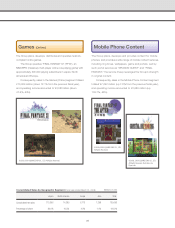
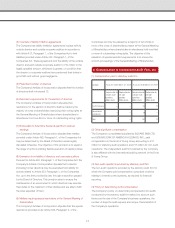
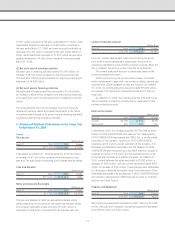
The Group plans, develops, distributes and operates network-
compliant online games.
The Group operates “FINAL FANTASY XI” (“FFXI”), an
MMORPG (massively multi-player online role-playing game) with
approximately 500,000 paying subscribers in Japan, North
America and Europe.
Consequently, sales in the Games (Online) segment totaled
¥10,629 million (down 12.1% from the previous fiscal year),
and operating income amounted to ¥3,087million (down
47.5%, ditto).
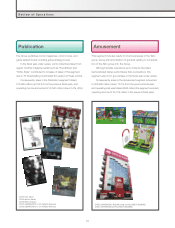
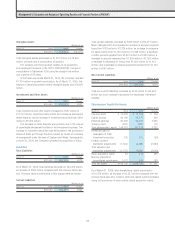
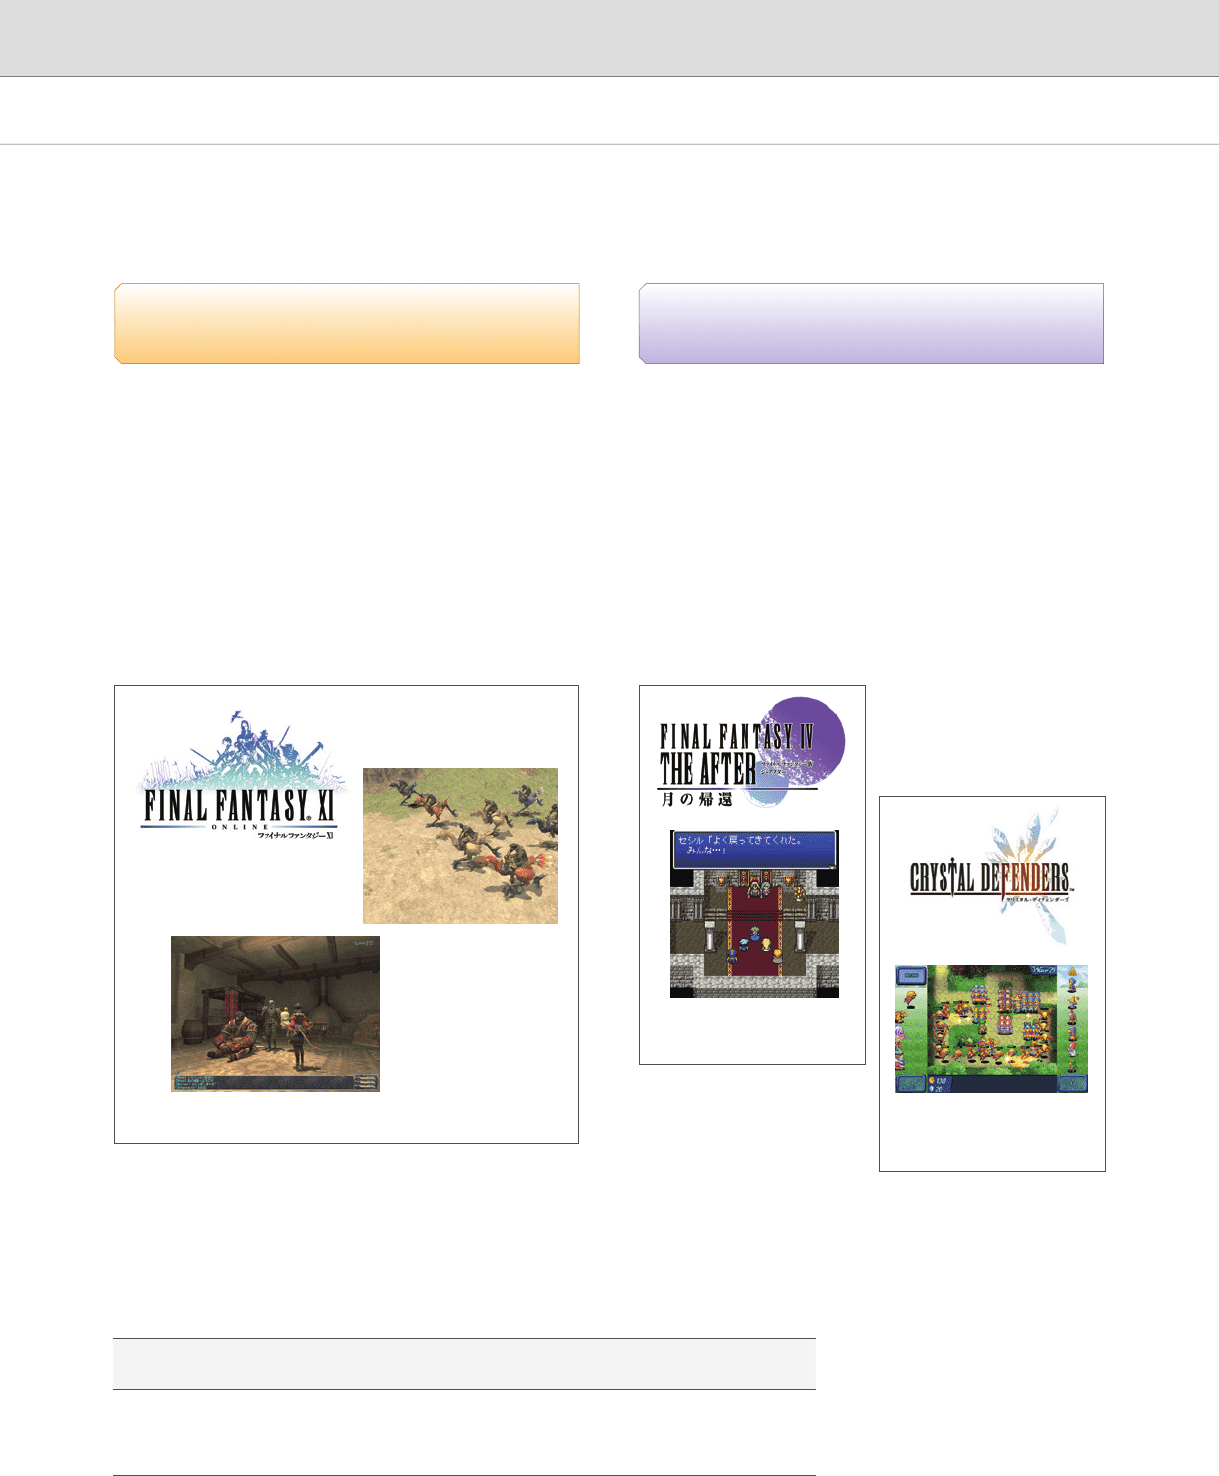
The Group plans, develops and provides content for mobile
phones, and provides a wide range of mobile content services,
including ring tones, wallpapers, game and portals. Led by
such portal services as “DRAGON QUEST” and “FINAL
FANTASY,” the service lineup leverages the Group’s strength
in original content.
Consequently, sales in the Mobile Phone Content segment
totaled ¥7,092 million (up 7.8% from the previous fiscal year),
and operating income amounted to ¥3,689 million (up
109.7%, ditto).
©2002-2009 SQUARE ENIX CO., LTD. All Rights Reserved.
©2008,2009 SQUARE ENIX CO., LTD.
All Rights Reserved.
©2008, 2009 SQUARE ENIX CO., LTD.
All Rights Reserved. Illustrations by
Ryoma Ito
Games (Online) Mobile Phone Content
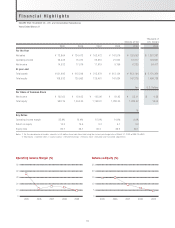
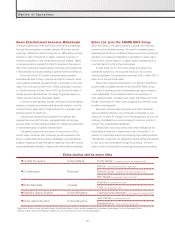
Consolidated Sales by Geographic Segment (Fiscal year ended March 31, 2009) (Millions of yen)
Japan North America
Europe
Asia Total
Consolidated net sales 113,396 14,285 6,713 1,298 135,693
Percentage of share 83.6% 10.5% 4.9% 1.0% 100.0%
09