SkyWest Airlines 2007 Annual Report Download - page 50
Download and view the complete annual report
Please find page 50 of the 2007 SkyWest Airlines annual report below. You can navigate through the pages in the report by either clicking on the pages listed below, or by using the keyword search tool below to find specific information within the annual report.-
 1
1 -
2
-
3
-
4
-
5
-
6
-
7
-
8
-
9
-
10
-
11
-
12
-
13
-
14
-
15
-
16
-
17
-
18
-
19
-
20
-
21
-
22
-
23
-
24
-
25
-
26
-
27
-
28
-
29
-
30
-
31
-
32
-
33
-
34
-
35
-
36
-
37
-
38
-
39
-
 40
40 -
 41
41 -
 42
42 -
 43
43 -
 44
44 -
 45
45 -
 46
46 -
 47
47 -
 48
48 -
 49
49 -
 50
50 -
 51
51 -
 52
52 -
 53
53 -
 54
54 -
 55
55 -
 56
56 -
 57
57 -
 58
58 -
 59
59 -
 60
60 -
61
-
62
-
63
-
64
-
65
-
66
-
67
-
68
 |
 |

49
or converted into common stock. The computation of Diluted EPS does not assume exercise or conversion of securities that
would have an anti-dilutive effect on net income per common share. During the years ended December 31, 2007, 2006 and
2005, 529,000, 1,219,000 and 2,378,000 shares reserved for issuance upon the exercise of outstanding options were excluded
from the computation of Diluted EPS respectively, as their inclusion would be anti-dilutive.
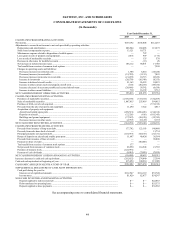
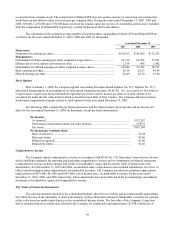
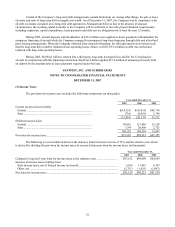
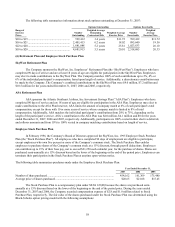
The calculation of the weighted average number of common shares outstanding for Basic EPS and Diluted EPS are
as follows for the years ended December 31, 2007, 2006 and 2005 (in thousands):
Year Ended December 31,
2007 2006 2005
Numerator:
Numerator for earnings per share ................................................................................... $159,192 $145,806 $112,267
Denominator:
Denominator for basic earnings per-share weighted average shares .............................. 62,710 62,474 57,851
Dilution due to stock options and restricted stock .......................................................... 1,334 908 1,082
Denominator for diluted earnings per-share weighted average shares............................ 64,044 63,382 58,933
Basic earnings per-share ................................................................................................. $2.54 $2.33 $1.94
Diluted earnings per-share.............................................................................................. $2.49 $2.30 $1.90
Stock Options
Prior to January 1, 2006, the Company applied Accounting Principles Board Opinion No. 25 (“Opinion No. 25”),
and related interpretations in accounting for its stock-based compensation plans. SFAS No. 123, Accounting for Stock-Based
Compensation, requires pro forma information regarding net income and net income per share as if stock options were
accounted for under the fair value method which is described more fully in Note 5 below. The Company did not record any
stock-based compensation expense related to stock options for the year ended December 31, 2005.
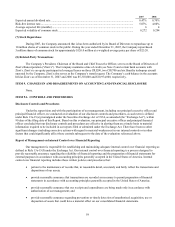
The following table contains the pro forma disclosures and the related impact on net income and net income per
share for the year ended December 31, 2005 (in thousands, except per share information):
Net income:
As reported .................................................................................................................... $112,267
Stock based compensation under fair value method...................................................... (4,927)
Pro forma....................................................................................................................... $107,340
Net income per common share:
Basic as reported............................................................................................................ $1.94
Basic pro forma ............................................................................................................. $1.86
Diluted as reported......................................................................................................... $1.90
Diluted pro forma .......................................................................................................... $1.82
Comprehensive Income
The Company reports comprehensive income in accordance with SFAS No. 130, Reporting Comprehensive Income,
which establishes standards for reporting and displaying comprehensive income and its components in financial statements.
Comprehensive income includes charges and credits to stockholders’ equity that are not the result of transactions with
shareholders. As of December 31, 2007 and 2006, accumulated other comprehensive loss included adjustments, net of tax, to
reflect unrealized appreciation (depreciation) on marketable securities. The Company recorded net unrealized appreciation
(depreciation) of $475,000, $61,000 and $(347,000), net of income taxes, on marketable securities for the years ended
December 31, 2007, 2006, and 2005 respectively. These adjustments have been reflected in the accompanying consolidated
statements of stockholders’ equity and comprehensive income.
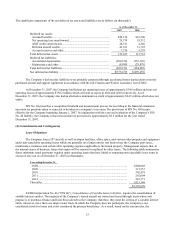
Fair Value of Financial Instruments
The carrying amounts reported in the consolidated balance sheets for receivables and accounts payable approximate
fair values because of the immediate or short-term maturity of these financial instruments. Marketable securities are reported
at fair value based on market quoted prices in the consolidated balance sheets. The fair value of the Company’ s long-term
debt is estimated based on current rates offered to the Company for similar debt and approximates $1,838.6 million as of