SkyWest Airlines 2007 Annual Report Download - page 35
Download and view the complete annual report
Please find page 35 of the 2007 SkyWest Airlines annual report below. You can navigate through the pages in the report by either clicking on the pages listed below, or by using the keyword search tool below to find specific information within the annual report.-
 1
1 -
2
-
3
-
4
-
5
-
6
-
7
-
8
-
9
-
10
-
11
-
12
-
13
-
14
-
15
-
16
-
17
-
18
-
19
-
20
-
21
-
22
-
23
-
24
-
 25
25 -
 26
26 -
 27
27 -
 28
28 -
 29
29 -
 30
30 -
 31
31 -
 32
32 -
 33
33 -
 34
34 -
 35
35 -
 36
36 -
 37
37 -
 38
38 -
 39
39 -
 40
40 -
 41
41 -
 42
42 -
 43
43 -
 44
44 -
 45
45 -
46
-
47
-
48
-
49
-
50
-
51
-
52
-
53
-
54
-
55
-
56
-
57
-
58
-
59
-
60
-
61
-
62
-
63
-
64
-
65
-
66
-
67
-
68
 |
 |

34
period of 2005. The increase was primarily a result of a 58.9% increase in ASMs (which resulted principally from the
acquisition of ASA in September 2005 and additional aircraft delivered in 2006). Airline operating and interest expenses,
excluding fuel charges, per ASM decreased 2.1% to 9.3¢ for the year ended December 31, 2006, from 9.5¢ for the year ended
December 31, 2005. The primary reason for the decrease was the operating efficiencies obtained from increased stage lengths
flown by our regional jets.
Operating and Interest Expenses. Operating and interest expenses increased 61.0% to $2.9 billion for the year
ended December 31, 2006, compared to $1.8 billion for the year ended December 31, 2005. The increase in total operating
and interest expenses was due principally to the acquisition of ASA in September 2005 and additional aircraft delivered in
2006. As a percentage of consolidated operating revenues, total operating and interest expenses increased to 92.9% for the
year ended December 31, 2006, from 91.5% for the year ended December 31, 2005. The increase in operating and interest
expenses as a percentage of consolidated operating revenues was primarily due to significant increases in fuel costs year-
over-year.
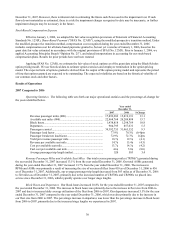
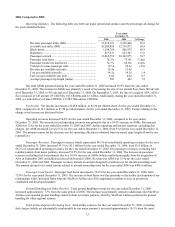
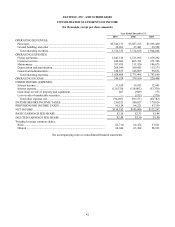
The following tables set forth information regarding our operating expense components for the years ended
December 31, 2006 and 2005. Operating expenses are expressed as a percentage of operating revenues. Individual expense
components are also expressed as cents per ASM.
Year ended December 31,
2006 2005
Amount
Percentage
of
Revenue
Cents
per
ASM Amount
Percentage
of
Revenue
Cents
per
ASM
(in thousands) (in thousands)
Salaries, wages and employee benefits................. $673,961 21.6% 3.3¢ $434,218 22.1% 3.4¢
Aircraft costs......................................................... 471,381 15.1 2.3 325,771 16.6 2.6
Maintenance.......................................................... 220,705 7.1 1.1 129,626 6.6 1.0
Fuel ....................................................................... 1,010,717 32.5 5.0 590,776 30.1 4.6
Other airline expenses........................................... 398,732 12.8 2.0 263,248 13.4 2.1
Interest .................................................................. 118,002 3.8 0.6 53,331 2.7 0.4
Total airline expenses ........................................... $2,893,498 14.3 $1,796,970 14.1
The cost per ASM of salaries, wages and employee benefits decreased to 3.3¢ for the year ended December 31,
2006, compared to 3.4¢ for the year ended December 31, 2005. The average number of full-time equivalent employees
increased 8.6% to 14,450 for the year ended December 31, 2006 from 13,304 for the year ended December 31, 2005. The
increase in number of employees was primarily due to the addition of personnel required for the new regional jet flying and
due to the addition of personnel required for new cities added to our ground handling service contracts.
The cost per ASM for aircraft costs, including aircraft rent and depreciation, decreased to 2.3¢ for the year ended
December 31, 2006, from 2.6¢ for the year ended December 31, 2005. The decrease in cost per ASM was primarily due to
the addition of ASA’ s regional jet fleet and the addition of nine CRJ900s and 15 CRJ 700s, which have a lower operating
cost per ASM than CRJ200s and our existing turboprop fleets.
The cost per ASM for maintenance expense increased to 1.1¢ for the year ended December 31, 2006, from 1.0¢ for
the year ended December 31, 2005. The increase in the cost per ASM was primarily attributed to timing of maintenance
events associated with a higher average age of our CRJ200 and CRJ700 fleets. The “Maintenance” line in the table set forth
above does not include salaries, wages and employee benefits associated with our maintenance operations (those costs are
included in the “Salary, wages and employee benefits” line in the table). Accordingly, the amount for “Maintenance” in the
table above differs from the maintenance expense in our Consolidated Statements of Income set forth in Item 8 below. Under
the United Express Agreement, specific amounts are included in the rates charged to United for mature maintenance on
regional jet engines that we record as revenue. However, consistent with the direct expense maintenance policy, we record
maintenance expense on our CRJ200 engines as it is incurred. As a result, during the year ended December 31, 2006, we
collected and recorded as revenue $27.7 million (pretax) under the United Express Agreement, with no material offset to
CRJ200 engine maintenance overhauls.
The cost per ASM for fuel increased 8.7% to 5.0¢ for the year ended December 31, 2006, from 4.6¢ for the year
ended December 31, 2005. This increase was primarily due to the average price of fuel increasing to $2.20 per gallon during
the year ended December 31, 2006, from $2.05 per gallon for the year ended December 31, 2005.