SkyWest Airlines 2007 Annual Report Download - page 34
Download and view the complete annual report
Please find page 34 of the 2007 SkyWest Airlines annual report below. You can navigate through the pages in the report by either clicking on the pages listed below, or by using the keyword search tool below to find specific information within the annual report.-
 1
1 -
2
-
3
-
4
-
5
-
6
-
7
-
8
-
9
-
10
-
11
-
12
-
13
-
14
-
15
-
16
-
17
-
18
-
19
-
20
-
21
-
22
-
23
-
 24
24 -
 25
25 -
 26
26 -
 27
27 -
 28
28 -
 29
29 -
 30
30 -
 31
31 -
 32
32 -
 33
33 -
 34
34 -
 35
35 -
 36
36 -
 37
37 -
 38
38 -
 39
39 -
 40
40 -
 41
41 -
 42
42 -
 43
43 -
 44
44 -
45
-
46
-
47
-
48
-
49
-
50
-
51
-
52
-
53
-
54
-
55
-
56
-
57
-
58
-
59
-
60
-
61
-
62
-
63
-
64
-
65
-
66
-
67
-
68
 |
 |

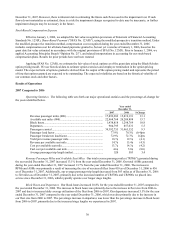
33
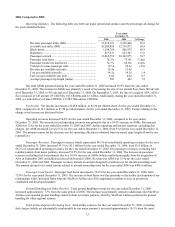
2006 Compared to 2005
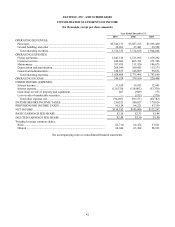
Operating Statistics. The following table sets forth our major operational statistics and the percentage-of-change for
the years identified below.
Year ended
December 31,
2006 2005 %Change
Revenue passenger miles (000) ......................................... 15,819,191 9,538,906 65.8
Available seat miles (000) ................................................. 20,209,888 12,718,973 58.9
Block hours........................................................................ 1,298,769 866,975 49.8
Departures ......................................................................... 857,631 623,307 37.6
Passengers carried ............................................................. 31,465,552 20,343,975 54.7
Passenger load factor......................................................... 78.3% 75.0% 3.3pts
Passenger breakeven load factor........................................ 72.7% 68.6% 4.1pts
Yield per revenue passenger mile...................................... 19.5¢ 20.3¢ (3.9)
Revenue per available seat mile ........................................ 15.4¢ 15.4¢ —
Cost per available seat mile............................................... 14.3¢ 14.1¢ 1.4
Fuel cost per available seat mile........................................ 5.0¢ 4.6¢ 8.7
Average passenger trip length (miles) ............................... 503 469 7.2
Our total ASMs generated during the year ended December 31, 2006 increased 58.9% from the year ended
December 31, 2005. The increase in ASMs was primarily a result of increasing the size of our aircraft fleet, from 380 aircraft
as of December 31, 2005, to 410 aircraft as of December 31, 2006. On September 7, 2005, the date we acquired ASA, ASA’ s
fleet consisted of 149 aircraft (35 CRJ700s, 102 CRJ200s and 12 ATRs). Additionally, during the year ended December 31,
2006, we took delivery of nine CRJ900s, 15 CRJ 700s and six CRJ200s.
Net Income. Net income increased to $145.8 million, or $2.30 per diluted share, for the year ended December 31,
2006, compared to $112.3 million, or $1.90 per diluted share, for the year ended December 31, 2005. Factors relating to the
change in net income are discussed below.
Operating revenues increased 58.6% for the year ended December 31, 2006, compared to the year ended
December 31, 2005. The increase in total operating revenues was primarily due to a 58.9% increase in ASMs. Revenue per
ASM was 15.4¢ for the years ended December 31, 2006 and 2005. Airline operating and interest expenses, excluding fuel
charges, per ASM decreased 2.1% to 9.3¢ for the year ended December 31, 2006, from 9.5¢ for the year ended December 31,
2005. The primary reason for the decrease was the operating efficiencies obtained from increased stage lengths flown by our
regional jets.
Passenger Revenues. Passenger revenues, which represented 99.1% of consolidated operating revenues for the year
ended December 31, 2006, increased 59.3% to $3.1 billion for the year ended December 31, 2006, from $1.9 billion, or
98.7% of consolidated operating revenues, for the year ended December 31, 2005. Our passenger revenues, excluding fuel
reimbursements from major partners, increased 53.5% for the year ended December 31, 2006. The increase in passenger
revenues excluding fuel was primarily due to a 58.9% increase in ASMs (which resulted principally from the acquisition of
ASA in September 2005 and additional aircraft delivered in 2006). Revenue per ASM was 15.4¢ for the years ended
December 31, 2006 and 2005. Passenger revenues include an amount designed to reimburse us for aircraft ownership costs.
The amount deemed to be rental income related to aircraft ownership costs for the year ended 2006 was $486.6 million.
Passenger Load Factor. Passenger load factor increased to 78.3% for the year ended December 31, 2006, from
75.0% for the year ended December 31, 2005. The increase in load factor was due primarily to the further development of our
relationships with United and Delta whereby SkyWest Airlines and ASA supplement mainline service in previously
established and developed markets.
Ground Handling and Other Revenue. Total ground handling revenue for the year ended December 31, 2006
increased approximately 7.2% from the same period of 2005. The increase was primarily related to additional cities SkyWest
Airlines was awarded ground handling contracts from our major partners, whereby, SkyWest Airlines performs the ground
handling for other regional airlines.
Total Airline Expenses Excluding Fuel. Total airline expenses for the year ended December 31, 2006, excluding
fuel charges (which are substantially reimbursable by our major partners), increased approximately 56.1% from the same