SkyWest Airlines 2007 Annual Report Download - page 31
Download and view the complete annual report
Please find page 31 of the 2007 SkyWest Airlines annual report below. You can navigate through the pages in the report by either clicking on the pages listed below, or by using the keyword search tool below to find specific information within the annual report.-
 1
1 -
2
-
3
-
4
-
5
-
6
-
7
-
8
-
9
-
10
-
11
-
12
-
13
-
14
-
15
-
16
-
17
-
18
-
19
-
20
-
 21
21 -
 22
22 -
 23
23 -
 24
24 -
 25
25 -
 26
26 -
 27
27 -
 28
28 -
 29
29 -
 30
30 -
 31
31 -
 32
32 -
 33
33 -
 34
34 -
 35
35 -
 36
36 -
 37
37 -
 38
38 -
 39
39 -
 40
40 -
 41
41 -
42
-
43
-
44
-
45
-
46
-
47
-
48
-
49
-
50
-
51
-
52
-
53
-
54
-
55
-
56
-
57
-
58
-
59
-
60
-
61
-
62
-
63
-
64
-
65
-
66
-
67
-
68
 |
 |

30
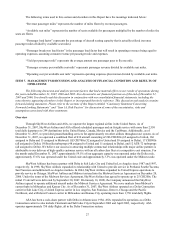
December 31, 2007. However, there is inherent risk in estimating the future cash flows used in the impairment test. If cash
flows do not materialize as estimated, there is a risk the impairment charges recognized to date may be inaccurate, or further
impairment charges may be necessary in the future.
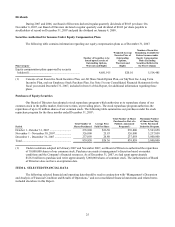
Stock-Based Compensation Expense
Effective January 1, 2006, we adopted the fair value recognition provisions of Statement of Financial Accounting
Standards No. 123(R), Share-Based Payment (“SFAS No. 123(R)”), using the modified-prospective transition method. Under
the modified-prospective transition method, compensation cost recognized during the year ended December 31, 2006
includes compensation cost for all share-based payments granted to, but not yet vested as of January 1, 2006, based on the
grant date fair value estimated in accordance with the original provisions of SFAS No. 123(R). Prior to January 1, 2006, we
applied Accounting Principles Board (“Opinion No. 25”), and related interpretations in accounting for our stock-based
compensation plans. Results for prior periods have not been restated.
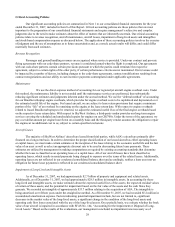
Applying SFAS No. 123(R), we estimate the fair value of stock options as of the grant date using the Black-Scholes
option pricing model. We use historical data to estimate option exercises and employee termination in the option pricing
model. The expected term of options granted is derived from the output of the option pricing model and represents the period
of time that options granted are expected to be outstanding. The expected volatilities are based on the historical volatility of
our common stock and other factors.
Results of Operations
2007 Compared to 2006
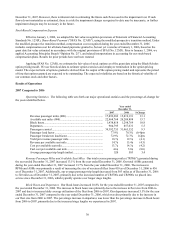
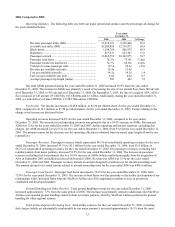
Operating Statistics. The following table sets forth our major operational statistics and the percentage-of-change for
the years identified below.
Year ended
December 31,
2007 2006 %Change
Revenue passenger miles (000) ................................................... 17,892,282 15,819,191 13.1
Available seat miles (000) ........................................................... 22,968,768 20,209,888 13.7
Block hours.................................................................................. 1,438,818 1,298,769 10.8
Departures ................................................................................... 904,795 857,631 5.5
Passengers carried ....................................................................... 34,392,755 31,465,552 9.3
Passenger load factor................................................................... 77.9% 78.3% (0.4)pts
Passenger breakeven load factor.................................................. 72.9% 72.7% 0.2pts
Yield per revenue passenger mile................................................ 18.7¢ 19.5¢ (4.1)
Revenue per available seat mile .................................................. 14.7¢ 15.4¢ (4.5)
Cost per available seat mile......................................................... 13.7¢ 14.3¢ (4.2)
Fuel cost per available seat mile.................................................. 4.6¢ 5.0¢ (8.0)
Average passenger trip length (miles) ......................................... 520 503 3.4
Revenue Passenger Miles and Available Seat Miles. Our total revenue passenger miles (“RPMs”) generated during
the year ended December 31, 2007 increased 13.1% from the year ended December 31, 2006. Our total ASMs generated
during the year ended December 31, 2007 increased 13.7% from the year ended December 31, 2006. The increase in
RPMs and ASMs was primarily a result of increasing the size of our aircraft fleet from 410 as of December 31, 2006 to 436
as of December 31, 2007. Additionally, our average passenger trip length increased from 503 miles as of December 31, 2006
to 520 miles as of December 31, 2007, primarily due to the increased number of CRJ700s and CRJ900s we placed into
service since December 31, 2006, which typically operate over longer stage lengths.
Block Hours and Departures. Our block hours increased 10.8% for the year ended December 31, 2007 compared to
the year ended December 31, 2006. The increase in block hours was primarily due to the increase in fleet size from 2006 to
2007 and due to increased daily average utilization of the fleet from 2006 to 2007. Our departures increased 5.5% for the year
ended December 31, 2007 compared to the year ended December 31, 2006, which was also primarily due to the increase in
our fleet size from 2006 to 2007. The percentage increase in departures was lower than the percentage increase in block hours
from 2006 to 2007, primarily due to the increased stage lengths we experienced in 2007.