SkyWest Airlines 2007 Annual Report Download - page 27
Download and view the complete annual report
Please find page 27 of the 2007 SkyWest Airlines annual report below. You can navigate through the pages in the report by either clicking on the pages listed below, or by using the keyword search tool below to find specific information within the annual report.-
 1
1 -
2
-
3
-
4
-
5
-
6
-
7
-
8
-
9
-
10
-
11
-
12
-
13
-
14
-
15
-
16
-
 17
17 -
 18
18 -
 19
19 -
 20
20 -
 21
21 -
 22
22 -
 23
23 -
 24
24 -
 25
25 -
 26
26 -
 27
27 -
 28
28 -
 29
29 -
 30
30 -
 31
31 -
 32
32 -
 33
33 -
 34
34 -
 35
35 -
 36
36 -
 37
37 -
38
-
39
-
40
-
41
-
42
-
43
-
44
-
45
-
46
-
47
-
48
-
49
-
50
-
51
-
52
-
53
-
54
-
55
-
56
-
57
-
58
-
59
-
60
-
61
-
62
-
63
-
64
-
65
-
66
-
67
-
68
 |
 |

26
Selected Consolidated Financial Data (amounts in thousands, except per share data):
Year Ended December 31,
2007 2006 2005(2) 2004 2003
Operating revenues ................................................................ $3,374,332 $3,114,656 $1,964,048 $1,156,044 $888,026
Operating income................................................................... 344,524 339,160 220,408 144,776 108,480
Net income............................................................................. 159,192 145,806 112,267 81,952 66,787
Net income per common share:
Basic ................................................................................... $2.54 $2.33 $1.94 $1.42 $1.16
Diluted ................................................................................ 2.49 2.30 1.90 1.40 1.15
Weighted average shares:
Basic ................................................................................... 62,710 62,474 57,851 57,858 57,745
Diluted ................................................................................ 64,044 63,382 58,933 58,350 58,127
Total assets ............................................................................ $3,990,525 $3,731,419 $3,320,646 $1,662,287 $1,529,210
Current assets......................................................................... 1,210,139 1,095,454 693,632 712,337 670,368
Current liabilities ................................................................... 398,219 408,431 615,917 170,467 151,959
Long-term debt, net of current maturities .............................. 1,732,748 1,675,626 1,422,758 463,233 462,773
Stockholders’ equity .............................................................. 1,246,007 1,178,293 913,198 779,055 709,063
Return on average equity(1) .................................................. 13.1% 13.9% 13.2% 11.0% 9.9%
Cash dividends declared per common share.......................... $0.12 $0.12 $0.12 $0.12 $0.08
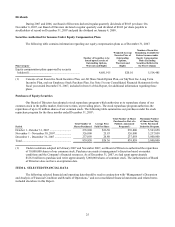
(1) Calculated by dividing net income by the average of beginning and ending stockholders’ equity for the year
(2) On September 7, 2005, we completed the acquisition of ASA from Delta for $421.3 million in cash. We paid
$5.3 million of transaction fees and assumed approximately $1.25 billion in long-term debt and related assets. Our
2005 consolidated operating revenues contain 114 days of additional revenue and expenses generated by the ASA
acquisition.
Selected Operating Data
Year Ended December 31,
2007 2006 2005 2004 2003
Block hours............................................................................ 1,438,818 1,298,769 866,975 589,129 482,158
Departures.............................................................................. 904,795 857,631 623,307 464,697 395,631
Passengers carried.................................................................. 34,392,755 31,465,552 20,343,975 13,424,520 10,738,691
Revenue passenger miles (000) ............................................. 17,892,282 15,819,191 9,538,906 5,546,069 4,222,669
Available seat miles (000) ..................................................... 22,968,768 20,209,888 12,718,973 7,546,318 5,875,029
Passenger load factor ............................................................. 77.9% 78.3% 75.0% 73.5% 71.9%
Passenger break-even load factor........................................... 72.9% 72.7% 68.6% 65.5% 63.9%
Yield per revenue passenger mile .......................................... 18.7¢ 19.5¢ 20.3¢ 20.5¢ 20.9¢
Revenue per available seat mile............................................. 14.7¢ 15.4¢ 15.4¢ 15.3¢ 15.1¢
Cost per available seat mile ................................................... 13.7¢ 14.3¢ 14.1¢ 13.6¢ 13.4¢
Average passenger trip length................................................ 520 503 469 413 393
Number of operating aircraft at end of year........................... 436 410 380 206 185
Quarterly Financial Data
Year Ended December 31, 2007
First
Quarter
Second
Quarter
Third
Quarter
Fourth
Quarter Year
Operating revenues (000) ...................................................... $788,968 $855,048 $875,601 $854,715 $3,374,332
Operating income (000)......................................................... 79,575 88,855 92,469 83,625 344,524
Net income (000)................................................................... 34,788 40,622 42,927 40,855 159,192
Net income per common share:
Basic ...................................................................................... $0.54 $0.64 $0.69 $0.67 $2.54
Diluted ................................................................................... 0.53 0.62 0.68 0.66 2.49
Weighted average common shares:
Basic: ..................................................................................... 64,279 63,811 61,942 60,807 62,710
Diluted:.................................................................................. 65,837 65,245 62,888 62,204 64,044