SkyWest Airlines 2007 Annual Report Download - page 33
Download and view the complete annual report
Please find page 33 of the 2007 SkyWest Airlines annual report below. You can navigate through the pages in the report by either clicking on the pages listed below, or by using the keyword search tool below to find specific information within the annual report.-
 1
1 -
2
-
3
-
4
-
5
-
6
-
7
-
8
-
9
-
10
-
11
-
12
-
13
-
14
-
15
-
16
-
17
-
18
-
19
-
20
-
21
-
22
-
 23
23 -
 24
24 -
 25
25 -
 26
26 -
 27
27 -
 28
28 -
 29
29 -
 30
30 -
 31
31 -
 32
32 -
 33
33 -
 34
34 -
 35
35 -
 36
36 -
 37
37 -
 38
38 -
 39
39 -
 40
40 -
 41
41 -
 42
42 -
 43
43 -
44
-
45
-
46
-
47
-
48
-
49
-
50
-
51
-
52
-
53
-
54
-
55
-
56
-
57
-
58
-
59
-
60
-
61
-
62
-
63
-
64
-
65
-
66
-
67
-
68
 |
 |
32
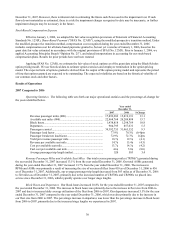
the additional aircraft we placed into service between December 31, 2006 and December 31, 2007, and related ground
handling operations. The decrease in the cost per ASM for salaries, wages and employee benefits was primarily due to
efficiencies obtained through operating larger aircraft over increased stage lengths.
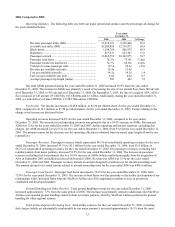
Aircraft Costs. The cost per ASM for aircraft costs, including aircraft rent and depreciation, decreased to 2.2¢ for
the year ended December 31, 2007 from 2.3¢ for the year ended December 31, 2006. The decrease in cost per ASM was
primarily due to the addition of 10 CRJ700s and eight CRJ900s between December 31, 2006 and December 31, 2007.
CRJ700s and CRJ900s have lower ownership costs per ASM than our existing CRJ200 and turboprop aircraft.
Maintenance. The cost per ASM for maintenance expense increased to 1.3¢ for the year ended December 31, 2007,
compared to 1.1¢ for the year ended December 31, 2006. The increase was primarily related to the timing of engine overhaul
events on aircraft operated under our Delta Connection Agreements and other direct maintenance events during the year
ended December 31, 2007. Under our United Express Agreement and our Midwest Agreement, specific amounts are included
in the rates and charges for mature maintenance on regional jet engines that we record as revenue. However, consistent with
the direct expense maintenance policy, we record maintenance expense on our CRJ200 engines as it is incurred. As a result,
during the year ended December 31, 2007, we collected and recorded as revenue $30.3 million (pretax) under the United
Express Agreement and Midwest Services Agreement to compensate us for future engine maintenance overhauls. Because
the “Maintenance” category in the table above does not include salaries, wages and employee benefits associated with our
maintenance operations (those costs are included in the “Salary, wages and employee benefits” line in the table above), the
“Maintenance” expense line in the above table differs from the “Maintenance” line in our consolidated statements of income.
Fuel. The cost per ASM for fuel decreased 8.0% to 4.6¢ for the year ended December 31, 2007, from 5.0¢ for the
year ended December 31, 2006. The average cost per gallon of fuel increased to $2.41 per gallon during the year ended
December 31, 2007 from $2.20 during the year ended December 31, 2006. However, despite the increase in the average cost
per gallon, during the year ended December 31, 2007, United purchased fuel directly from a fuel vendor for our aircraft
operated out of Chicago, San Francisco, Los Angeles and Denver, which reduced our fuel costs and related passenger
revenue compared to the year ended December 31, 2006 by approximately $152.1 million.
Other airline expenses. The cost per ASM for other airline expenses, primarily consisting of landing fees, station
rentals, computer reservation system fees and hull and liability insurance, decreased 5.0% to 1.9¢ for the year ended
December 31, 2007, from 2.0¢ for the year ended December 31, 2006. The decrease in cost per ASM was primarily due to
the increased operating efficiencies obtained from increased stage lengths flown by our regional jets.
Interest. The cost per ASM for interest expense decreased 16.7% to 0.5¢ for the year ended December 31, 2007,
from 0.6¢ for the year ended December 31, 2006. The decrease in cost per ASM was primarily due to the addition of 8
CRJ900s between December 31, 2006 and December 31, 2007. CRJ 900s have lower ownership costs per ASM than CRJ200
and turboprop fleets. We also acquired ten CRJ700s during the year ended December 31, 2007 under sublease arrangements
with a major partner at nominal monthly amounts.
Total Airline Expenses. Total airline expenses (consisting of total operating and interest expenses) increased 9.1%
to $3.2 billion for the year ended December 31, 2007, compared to $2.9 billion for the year ended December 31, 2006. The
increase in total airline expense was primarily due the 13.7% increase in ASMs (which resulted principally from the increase
in our fleet size and the increase in the average passenger trip length). As a percentage of total operating revenues, total
airline expenses increased to 93.4% for the year ended December 31, 2007, from 92.9% for the year ended December 31,
2006. The increase in total airline expenses as a percentage of consolidated operating revenues was primarily due to increases
in salaries, wages and benefits and maintenance costs as described above.
Total Airline Expenses Excluding Fuel. Total airline expenses for the year ended December 31, 2007, excluding
fuel charges (which are substantially reimbursable by our major partners), increased approximately 11.2% from the year
ended December 31, 2006. The increase was primarily a result of a 13.7% increase in ASMs (which resulted principally from
the increase in our fleet size and the increase in the average passenger trip length). Total operating expenses for the year
ended December 31, 2007 increased at a lower rate than ASM growth, primarily due to the increased operating efficiencies
obtained from increased stage lengths flown by our regional jets.
Net Income. Net income increased to $159.2 million, or $2.49 per diluted share, for the year ended December 31,
2007, compared to $145.8 million, or $2.30 per diluted share, for the year ended December 31, 2006. The increase in our net
income was primarily due to the increase in our fleet size from 2006 to 2007 and associated increase in block hour production
from 2006 to 2007.