Singapore Airlines 2001 Annual Report Download - page 98
Download and view the complete annual report
Please find page 98 of the 2001 Singapore Airlines annual report below. You can navigate through the pages in the report by either clicking on the pages listed below, or by using the keyword search tool below to find specific information within the annual report.-
 1
1 -
2
-
3
-
4
-
5
-
6
-
7
-
8
-
9
-
10
-
11
-
12
-
13
-
14
-
15
-
16
-
17
-
18
-
19
-
20
-
21
-
22
-
23
-
24
-
25
-
26
-
27
-
28
-
29
-
30
-
31
-
32
-
33
-
34
-
35
-
36
-
37
-
38
-
39
-
40
-
41
-
42
-
43
-
44
-
45
-
46
-
47
-
48
-
49
-
50
-
51
-
52
-
53
-
54
-
55
-
56
-
57
-
58
-
59
-
60
-
61
-
62
-
63
-
64
-
65
-
66
-
67
-
68
-
69
-
70
-
71
-
72
-
73
-
74
-
75
-
76
-
77
-
78
-
79
-
80
-
81
-
82
-
83
-
84
-
85
-
86
-
87
-
 88
88 -
 89
89 -
 90
90 -
 91
91 -
 92
92 -
 93
93 -
 94
94 -
 95
95 -
 96
96 -
 97
97 -
 98
98 -
 99
99 -
 100
100 -
 101
101 -
 102
102 -
 103
103 -
 104
104 -
 105
105 -
 106
106 -
 107
107 -
 108
108 -
109
-
110
 |
 |

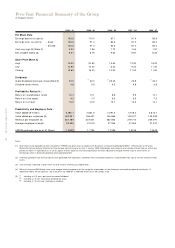
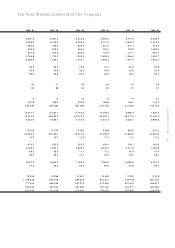
96 SIA annual report 00/01
2000 - 01 1999 - 00 1998 - 99 1997 - 98 1996 - 97
Per Share Data
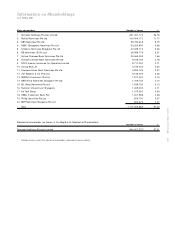
Earnings before tax (cents) 155.5 115.0 87.1 91.4 83.9
Earnings after tax (cents) – basic 126.5 91.4 80.6 81.0 80.4
– diluted 126.5 91.4 80.6 81.0 80.4
Cash earnings ($) [Note 3] 2.20 1.86 1.72 1.64 1.57
Net tangible assets ($) 9.51 8.76 9.50 8.87 8.22
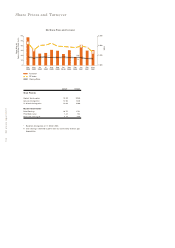
Share Price [Note 4]
High 19.20 20.80 13.60 13.90 15.00
Low 12.90 12.40 6.40 9.20 11.40
Closing 13.60 16.00 12.50 11.50 11.60
Dividends
Gross dividends (cents per share) [Note 5] 35.0 30.0 25.00 22.5 30.0
Dividend cover (times) 4.8 3.9 4.3 4.8 4.8
Profitability Ratios (% )
Return on shareholders’ funds 13.7 10.1 8.8 9.5 10.1
Return on total assets 9.2 7.0 6.3 6.9 7.5
Return on turnover 16.0 12.9 13.1 13.3 14.1
Productivity and Employee Data
Value added ($ million) 5,180.7 4,551.5 4,097.6 4,108.4 3,813.7
Value added per employee ($) 182,831 165,431 146,836 146,917 139,999
Revenue per employee ($) 351,189 327,801 282,943 279,710 269,091
Average employee strength 28,336 27,513 27,906 27,964 27,241
US$/S$ exchange rate as at 31 March 1.8029 1.7185 1.7295 1.6155 1.4449
Notes:
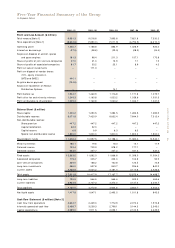
[1] Total revenue and expenditure were restated for 1999-00 and prior years to comply with Statement of Accounting Standard (SAS) 1 [Presentation of Financial
Statements] which became effective for financial year commencing on or after 1 January 2000. Accordingly, total revenue now includes interest income (which was
previously shown in expenditure as an offset against interest expense), and total expenditure has been adjusted to exclude interest income, and interest on
borrowings which is disclosed separately after operating profit.
[2] Internally generated cash flow comprises cash generated from operations, dividends from associated companies, and proceeds from sale of aircraft and other fixed
assets.
[3] Cash earnings is defined as profit after tax and minority interests plus depreciation.
[4] SIA local share and SIA Foreign share were merged following approval of the merger by shareholders at the Company’s extraordinary general meeting on 11
September 1999. For comparison, the share prices for 1996-97 to 1998-99 were that of SIA foreign share.
[5] r1 Including a 4.75 cents per share tax-exempt dividend.
r2 Including a 1.0 cent tax-exempt dividend per share.
r3 Including a 7.5 cents per share bonus dividend.
Five-Year Financial Summary of the Group
(In Singapore Dollars)
r1 r2 r3