Singapore Airlines 2001 Annual Report Download - page 44
Download and view the complete annual report
Please find page 44 of the 2001 Singapore Airlines annual report below. You can navigate through the pages in the report by either clicking on the pages listed below, or by using the keyword search tool below to find specific information within the annual report.-
 1
1 -
2
-
3
-
4
-
5
-
6
-
7
-
8
-
9
-
10
-
11
-
12
-
13
-
14
-
15
-
16
-
17
-
18
-
19
-
20
-
21
-
22
-
23
-
24
-
25
-
26
-
27
-
28
-
29
-
30
-
31
-
32
-
33
-
 34
34 -
 35
35 -
 36
36 -
 37
37 -
 38
38 -
 39
39 -
 40
40 -
 41
41 -
 42
42 -
 43
43 -
 44
44 -
 45
45 -
 46
46 -
 47
47 -
 48
48 -
 49
49 -
 50
50 -
 51
51 -
 52
52 -
 53
53 -
 54
54 -
55
-
56
-
57
-
58
-
59
-
60
-
61
-
62
-
63
-
64
-
65
-
66
-
67
-
68
-
69
-
70
-
71
-
72
-
73
-
74
-
75
-
76
-
77
-
78
-
79
-
80
-
81
-
82
-
83
-
84
-
85
-
86
-
87
-
88
-
89
-
90
-
91
-
92
-
93
-
94
-
95
-
96
-
97
-
98
-
99
-
100
-
101
-
102
-
103
-
104
-
105
-
106
-
107
-
108
-
109
-
110
 |
 |

42 SIA annual report 00/01
Financial Review
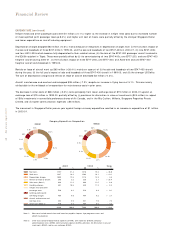
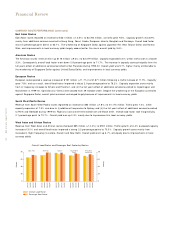
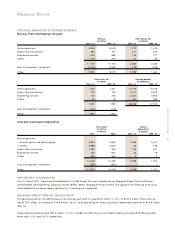
COM PANY ROUTE PERFORM ANCE (continued)
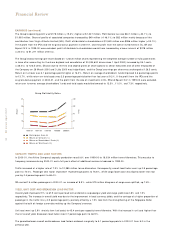
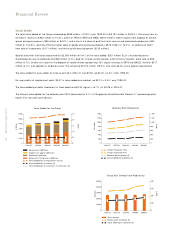
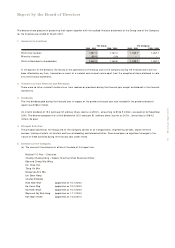
East Asian Routes
East Asian routes recorded an increase of $331 million (+13.5% ) to $2,784 million, as traffic grew 9.6% . Capacity growth was 8.9%
mainly from additional services mounted to Hong Kong, Seoul, Osaka, Denpasar, Jakarta, Bangkok and Surabaya. Overall load factor
was 0.5 percentage point better at 65.7% . The weakening of Singapore Dollar against Japanese Yen, New Taiwan Dollar and Korean
Won, and improvements in local currency yields largely accounted for the rise in overall yield by 3.6% .
American Routes
The American routes’ revenue went up $176 million (+9.2% ) to $2,079 million. Capacity expanded 4.6% whilst traffic rose at a slower
3.3% . Consequently, overall load factor went down 0.9 percentage point to 71.7% . The increase in capacity came principally from the
full year’s effect of additional services launched to San Francisco during 1999-00. Overall yield was 5.7% higher mainly attributable to
the weakening of Singapore Dollar against United States Dollar, and improvements in local currency yields.
European Routes
European routes posted a revenue increase of $197 million (+11.7% ) to $1,871 million following a traffic increase of 11.9% . Capacity
grew 7.8% and as a result, overall load factor improved a robust 2.9 percentage points to 78.2% . Capacity expansion came mainly
from (i) frequency increases to Athens and Frankfurt, and (ii) the full year’s effect of additional services launched to Copenhagen and
Manchester in 1999-00. Operations to Vienna were ceased from 29 October 2000. Despite the weakening of the European currencies
against Singapore Dollar, overall yield remained unchanged largely because of improvements in local currency yields.
South West Pacific Routes
Revenue from South West Pacific routes registered an increase of $85 million (+7.8% ) to $1,175 million. Traffic grew 7.4% , while
capacity expansion of 7.3% was due to (i) additional frequencies to Sydney, and (ii) the full year’s effect of additional services launched
to Perth and Adelaide during 1999-00. Flights to Cairns were terminated from 25 March 2001. Overall load factor rose marginally by
0.1 percentage point to 70.7% . Overall yield was up 0.3% mainly due to improvements in local currency yields.
West Asian and African Routes
Revenue from West Asian and African routes improved $85 million (+10.4% ) to $907 million. Traffic growth of 6.4% outpaced capacity
increase of 3.0% and overall load factor improved a strong 2.2 percentage points to 70.0% . Capacity growth came mainly from
increases in flight frequency to Lahore, Karachi and New Delhi. Overall yield went up 3.7% principally due to improvements in local
currency yields.
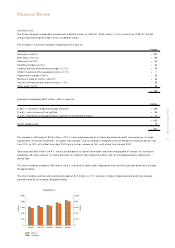
80
60
40
20
0
80
60
40
20
0
Overall Load Factor and Passenger Seat Factor by Routes
Percent
East Asia Americas Europe South West
Pacific West Asia
and Africa
Percent
■■■■ Overall Load Factor
■■■■ Passenger Seat Factor
2000/01
1999/00
2000/01
1999/00
2000/01
1999/00
2000/01
1999/00
2000/01
1999/00
2000/01
1999/00
2000/01
1999/00
2000/01
1999/00
2000/01
1999/00
2000/01
1999/00