Singapore Airlines 2001 Annual Report Download - page 78
Download and view the complete annual report
Please find page 78 of the 2001 Singapore Airlines annual report below. You can navigate through the pages in the report by either clicking on the pages listed below, or by using the keyword search tool below to find specific information within the annual report.-
 1
1 -
2
-
3
-
4
-
5
-
6
-
7
-
8
-
9
-
10
-
11
-
12
-
13
-
14
-
15
-
16
-
17
-
18
-
19
-
20
-
21
-
22
-
23
-
24
-
25
-
26
-
27
-
28
-
29
-
30
-
31
-
32
-
33
-
34
-
35
-
36
-
37
-
38
-
39
-
40
-
41
-
42
-
43
-
44
-
45
-
46
-
47
-
48
-
49
-
50
-
51
-
52
-
53
-
54
-
55
-
56
-
57
-
58
-
59
-
60
-
61
-
62
-
63
-
64
-
65
-
66
-
67
-
 68
68 -
 69
69 -
 70
70 -
 71
71 -
 72
72 -
 73
73 -
 74
74 -
 75
75 -
 76
76 -
 77
77 -
 78
78 -
 79
79 -
 80
80 -
 81
81 -
 82
82 -
 83
83 -
 84
84 -
 85
85 -
 86
86 -
 87
87 -
 88
88 -
89
-
90
-
91
-
92
-
93
-
94
-
95
-
96
-
97
-
98
-
99
-
100
-
101
-
102
-
103
-
104
-
105
-
106
-
107
-
108
-
109
-
110
 |
 |

76 SIA annual report 00/01
Notes to the Financial Statements
31 March 2001
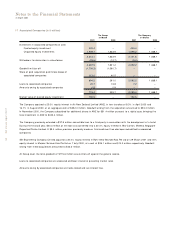
9 Earnings per Share
The Group The Company
2000 - 2001 1999 - 2000 2000 - 2001 1999 - 2000
Profit attributable to shareholders (in $ million) 1,549.3 1,163.8 1,339.7 1,267.1
Weighted average number of ordinary shares in issue used
for computing basic earnings per share (in million) 1,224.8 1,272.9 1,224.8 1,272.9
Adjustment for share options 0.4 0.4 0.4 0.4
Weighted average number of ordinary shares in issue used
for computing diluted earnings per share (in million) 1,225.2 1,273.3 1,225.2 1,273.3
Basic earnings per share (cents) 126.5 91.4 109.4 99.5
Diluted earnings per share (cents) 126.5 91.4 109.3 99.5
Basic earnings per share is calculated by dividing the profit attributable to shareholders by the weighted average number of
ordinary shares in issue during the financial year.
For purposes of calculating diluted earnings per share, the weighted average number of ordinary shares in issue is adjusted to take
into account the dilutive effect on the exercise of all outstanding share options granted to employees. This dilutive effect is
computed based on the difference between the number of shares under option and the number of shares that could have been
issued at fair values.
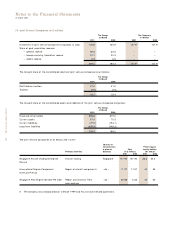
10 Share Capital (in $ million)
The Company
31 M arch
2001 2000
Authorised share capital
Ordinary shares
3,000,000,000 ordinary shares of $1 each 3,000.0 3,000.0
Special share
1 special share of $1 each * *
Preference shares
3,000,000,000 redeemable cumulative preference shares of $1 each 3,000.0 3,000.0
6,000.0 6,000.0
Issued share capital
Ordinary shares
Balance at 1 April
1,250,532,222 (1999 : 1,282,546,222) of $1 each fully paid 1,250.5 1,282.5
Shares repurchased for cancellation during the financial year
30,334,600 (1999-2000 : 32,014,000) (30.3) (32.0)
Balance at 31 March
1,220,197,622 (2000 : 1,250,532,222) of $1 each fully paid 1,220.2 1,250.5
Special share
Balance at 1 April
1 (1999 : nil) of $1 each fully paid * –
Nil (1999-2000 : 1) issued during the financial year – *
Balance at 31 March
1 (2000 : 1) of $1 each fully paid * *
1,220.2 1,250.5
* The value is $1.