Singapore Airlines 2001 Annual Report Download - page 97
Download and view the complete annual report
Please find page 97 of the 2001 Singapore Airlines annual report below. You can navigate through the pages in the report by either clicking on the pages listed below, or by using the keyword search tool below to find specific information within the annual report.-
 1
1 -
2
-
3
-
4
-
5
-
6
-
7
-
8
-
9
-
10
-
11
-
12
-
13
-
14
-
15
-
16
-
17
-
18
-
19
-
20
-
21
-
22
-
23
-
24
-
25
-
26
-
27
-
28
-
29
-
30
-
31
-
32
-
33
-
34
-
35
-
36
-
37
-
38
-
39
-
40
-
41
-
42
-
43
-
44
-
45
-
46
-
47
-
48
-
49
-
50
-
51
-
52
-
53
-
54
-
55
-
56
-
57
-
58
-
59
-
60
-
61
-
62
-
63
-
64
-
65
-
66
-
67
-
68
-
69
-
70
-
71
-
72
-
73
-
74
-
75
-
76
-
77
-
78
-
79
-
80
-
81
-
82
-
83
-
84
-
85
-
86
-
 87
87 -
 88
88 -
 89
89 -
 90
90 -
 91
91 -
 92
92 -
 93
93 -
 94
94 -
 95
95 -
 96
96 -
 97
97 -
 98
98 -
 99
99 -
 100
100 -
 101
101 -
 102
102 -
 103
103 -
 104
104 -
 105
105 -
 106
106 -
 107
107 -
108
-
109
-
110
 |
 |

95 SIA annual report 00/01
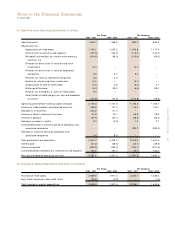
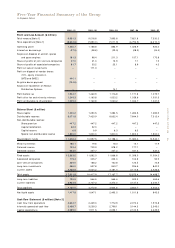
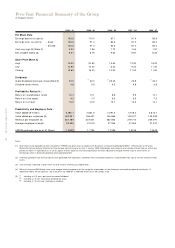
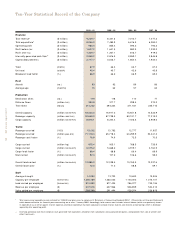
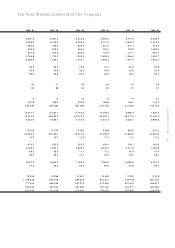
Five-Year Financial Summary of the Group
(In Singapore Dollars)
2000 - 01 1999 - 00 1998 - 99 1997 - 98 1996 - 97
Profit and Loss Account ($ million)
Total revenue [Note 1] 9,951.3 9,018.8 7,895.8 7,821.8 7,330.3
Total expenditure [Note 1] (8,604.6) (7,850.0) (7,011.9) (6,794.9) (6,410.1)
Operating profit 1,346.7 1,168.8 883.9 1,026.9 920.2
Interest on borrowings (37.5) (28.8) (29.5) (28.2) (24.5)
Surplus on disposal of aircraft, spares
and spare engines 181.3 98.4 211.3 157.1 173.8
Share of profits of joint venture companies 27.0 21.0 13.9 7.1 1.9
Share of profits of associated companies 81.7 33.2 23.1 8.9 4.3
Profit on sale of investments – 171.3 – – –
Profit on disposal of vendor shares
(13% equity interests in
SATS and SIAEC) 440.1 ––––
Ex-gratia bonus payment (134.6) ––––
Surplus on liquidation of Abacus
Distribution Systems – – 14.1 – –
Profit before tax 1,904.7 1,463.9 1,116.8 1,171.8 1,075.7
Profit after tax and minority interests 1,549.3 1,163.8 1,033.2 1,038.6 1,031.5
Profit attributable to shareholders 1,549.3 1,163.8 1,033.2 1,034.7 1,031.5
Balance Sheet ($ million)
Share capital 1,220.2 1,250.5 1,282.5 1,282.5 1,282.5
Distributable reserves 8,071.8 7,420.9 8,652.4 7,844.0 7,312.4
Non-distributable reserves
Share premium 447.2 447.2 447.2 447.2 447.2
Capital redemption 62.3 32.0 – – –
Capital reserve 6.9 6.9 6.3 6.3 –
Special non-distributable reserve 1,800.0 1,800.0 1,800.0 1,800.0 1,500.0
Shareholders’ funds 11,608.4 10,957.5 12,188.4 11,380.0 10,542.1
Minority interests 186.1 19.6 18.3 14.1 11.9
Deferred income 733.4 709.3 578.2 177.1 –
Deferred taxation 624.0 457.7 447.2 441.5 430.4
Fixed assets 12,863.0 11,882.0 11,666.8 11,398.0 11,054.3
Associated companies 715.4 305.7 223.0 102.8 94.9
Joint venture companies 239.0 188.2 152.8 125.5 72.8
Long-term investments 556.0 537.8 943.7 936.5 840.2
Current assets 3,538.5 3,504.2 4,181.4 3,110.6 2,426.5
Total assets 17,911.9 16,417.9 17,167.7 15,673.4 14,488.7
Long-term liabilities 795.5 566.5 565.6 523.3 463.6
Current liabilities 3,964.5 3,707.3 3,370.0 3,137.4 3,040.7
Total liabilities 4,760.0 4,273.8 3,935.6 3,660.7 3,504.3
Net liquid assets 1,417.8 1,647.1 2,493.0 1,511.8 843.5
Cash Flow Statement ($ million) [Note 2]
Cash flow from operations 2,644.7 2,429.0 1,772.9 2,070.4 1,974.8
Internally generated cash flow 3,438.7 3,239.3 2,798.1 3,144.3 2,345.0
Capital expenditure 2,589.0 1,911.5 2,053.1 2,120.5 2,449.5