Singapore Airlines 2001 Annual Report Download - page 68
Download and view the complete annual report
Please find page 68 of the 2001 Singapore Airlines annual report below. You can navigate through the pages in the report by either clicking on the pages listed below, or by using the keyword search tool below to find specific information within the annual report.-
 1
1 -
2
-
3
-
4
-
5
-
6
-
7
-
8
-
9
-
10
-
11
-
12
-
13
-
14
-
15
-
16
-
17
-
18
-
19
-
20
-
21
-
22
-
23
-
24
-
25
-
26
-
27
-
28
-
29
-
30
-
31
-
32
-
33
-
34
-
35
-
36
-
37
-
38
-
39
-
40
-
41
-
42
-
43
-
44
-
45
-
46
-
47
-
48
-
49
-
50
-
51
-
52
-
53
-
54
-
55
-
56
-
57
-
 58
58 -
 59
59 -
 60
60 -
 61
61 -
 62
62 -
 63
63 -
 64
64 -
 65
65 -
 66
66 -
 67
67 -
 68
68 -
 69
69 -
 70
70 -
 71
71 -
 72
72 -
 73
73 -
 74
74 -
 75
75 -
 76
76 -
 77
77 -
 78
78 -
79
-
80
-
81
-
82
-
83
-
84
-
85
-
86
-
87
-
88
-
89
-
90
-
91
-
92
-
93
-
94
-
95
-
96
-
97
-
98
-
99
-
100
-
101
-
102
-
103
-
104
-
105
-
106
-
107
-
108
-
109
-
110
 |
 |

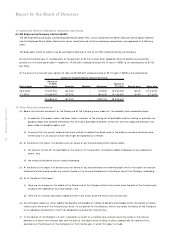
66 SIA annual report 00/01
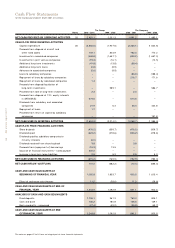
Cash Flow Statements
for the financial year ended 31 March 2001 (in $ million)
The Group The Company
Notes 2000 - 2001 1999 - 2000 2000 - 2001 1999 - 2000
NET CASH PROVIDED BY OPERATING ACTIVITIES 25 2,451.1 2,301.3 1,991.2 1,482.1
CASH FLOW FROM INVESTING ACTIVITIES
Capital expenditure 26 (2,555.5) (1,907.6) (2,336.1) (1,634.6)
Proceeds from disposal of aircraft and
other fixed assets 772.1 803.9 752.3 770.2
Investments in associated companies (448.8) (1,657.1) (403.2) (1,657.0)
Investments in joint venture companies (19.3) (16.1) – (10.5)
Additional long-term investments (41.9) (13.8) (38.4) –
Additional long-term loans (0.8) (8.9) – –
Advances to associated companies (2.6) (9.9) – –
Loans to subsidiary companies – – (83.3) (188.4)
Repayment of loans by subsidiary companies – – 216.7 171.6
Repayment of loans by associated companies 1.4 – – –
Proceeds from disposal/liquidation of
long-term investments – 589.1 – 586.7
Proceeds from sale of long-term investments 2.3 – 2.3 –
Proceeds from disposal of 13% equity interests
in SATS/SIAEC 574.6 – 574.6 –
Dividends from subsidiary and associated
companies 21.9 6.4 46.4 424.8
Repayment of loans 1.7 – – –
Proceeds from return of capital by subsidiary
companies – – – 151.8
NET CASH USED IN INVESTING ACTIVITIES (1,694.9) (2,214.0) (1,268.7) (1,385.4)
CASH FLOW FROM FINANCING ACTIVITIES
Share buyback (476.0) (509.7) (476.0) (509.7)
Dividends paid (323.2) (278.6) (323.2) (278.6)
Dividends paid by subsidiary companies to
minority interests (6.0) – – –
Dividends received from share buyback 3.8 – 3.8 –
Proceeds from/(repayment of) borrowings (16.3) 13.5 – –
Issuance of financial instruments – notes payable 200.0 – – –
Increase in long-term lease liabilities 2.5 5.3 2.5 5.3
NET CASH USED IN FINANCING ACTIVITIES (615.2) (769.5) (792.9) (783.0)
NET CASH INFLOW/ (OUTFLOW) 141.0 (682.2) (70.4) (686.3)
CASH AND CASH EQUIVALENTS AT
BEGINNING OF FINANCIAL YEAR 1,092.9 1,803.7 900.5 1,615.4
Effect of exchange rate changes 11.0 (28.6) 11.0 (28.6)
CASH AND CASH EQUIVALENTS AT END OF
FINANCIAL YEAR 1,244.9 1,092.9 841.1 900.5
ANALYSIS OF CASH AND CASH EQUIVALENTS
Fixed deposits 1,136.1 961.3 760.4 805.1
Cash and bank 136.2 180.8 106.6 139.1
Bank overdrafts – unsecured (27.4) (49.2) (25.9) (43.7)
CASH AND CASH EQUIVALENTS AT END
OF FINANCIAL YEAR 1,244.9 1,092.9 841.1 900.5
The notes on pages 67 to 91 form an integral part of these financial statements.