Singapore Airlines 2001 Annual Report Download - page 91
Download and view the complete annual report
Please find page 91 of the 2001 Singapore Airlines annual report below. You can navigate through the pages in the report by either clicking on the pages listed below, or by using the keyword search tool below to find specific information within the annual report.-
 1
1 -
2
-
3
-
4
-
5
-
6
-
7
-
8
-
9
-
10
-
11
-
12
-
13
-
14
-
15
-
16
-
17
-
18
-
19
-
20
-
21
-
22
-
23
-
24
-
25
-
26
-
27
-
28
-
29
-
30
-
31
-
32
-
33
-
34
-
35
-
36
-
37
-
38
-
39
-
40
-
41
-
42
-
43
-
44
-
45
-
46
-
47
-
48
-
49
-
50
-
51
-
52
-
53
-
54
-
55
-
56
-
57
-
58
-
59
-
60
-
61
-
62
-
63
-
64
-
65
-
66
-
67
-
68
-
69
-
70
-
71
-
72
-
73
-
74
-
75
-
76
-
77
-
78
-
79
-
80
-
 81
81 -
 82
82 -
 83
83 -
 84
84 -
 85
85 -
 86
86 -
 87
87 -
 88
88 -
 89
89 -
 90
90 -
 91
91 -
 92
92 -
 93
93 -
 94
94 -
 95
95 -
 96
96 -
 97
97 -
 98
98 -
 99
99 -
 100
100 -
 101
101 -
102
-
103
-
104
-
105
-
106
-
107
-
108
-
109
-
110
 |
 |

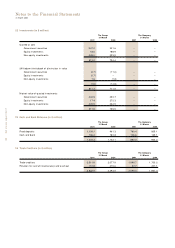
89 SIA annual report 00/01
Notes to the Financial Statements
31 March 2001
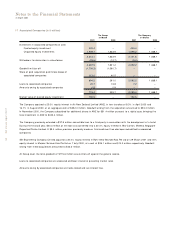
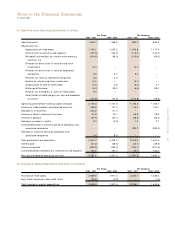
25 Cash Flow from Operating Activities (in $ million)
The Group The Company
2000 - 2001 1999 - 2000 2000 - 2001 1999 - 2000
Operating profit 1,346.7 1,168.8 983.4 855.4
Adjustments for:-
Depreciation of fixed assets 1,145.1 1,205.3 1,054.8 1,117.9
Income from investments and deposits (127.5) (163.9) (110.7) (142.7)
Writeback of provision for aircraft maintenance & (104.8) (48.6) (109.4) (49.5)
overhaul, net
Provision for diminution in value of long-term
investments 14.4 – 14.4 –
Provision for diminution in value of associated
companies 3.5 4.7 9.4 –
Provision for loans to associated companies 2.6 2.0 – –
Surplus on sale of long-term investments (3.1) – (0.1) –
(Surplus)/loss on sale of fixed assets (2.4) 0.8 (2.2) 2.1
Exchange differences (6.4) 28.2 (5.6) 28.0
Provision for writedown in value of fixed assets 9.0 – – –
Amortisation of deferred gain on sale and leaseback
of aircraft (100.8) (75.5) (100.8) (75.5)
Operating profit before working capital changes 2,176.3 2,121.8 1,733.2 1,735.7
Increase in trade creditors and deferred accounts 255.8 141.3 116.2 136.1
Decrease in investments 200.2 117.0 – –
Increase in sales in advance of carriage 67.6 76.7 65.5 78.5
Increase in debtors (57.9) (34.1) (28.0) (42.3)
Decrease/(increase) in stocks 2.3 (2.6) 1.9 2.7
Increase/(decrease) in amounts owing to subsidiary and
associated companies – – 280.7 (289.2)
Decrease in amounts owing by subsidiary and
associated companies 0.4 8.9 – –
Cash generated from operations 2,644.7 2,429.0 2,169.5 1,621.5
Interest paid (37.2) (28.5) (44.1) (39.8)
Income taxes paid (280.5) (266.4) (224.7) (221.6)
Interest/dividends received from investments and deposits 124.1 167.2 90.5 122.0
Net cash provided by operating activities 2,451.1 2,301.3 1,991.2 1,482.1
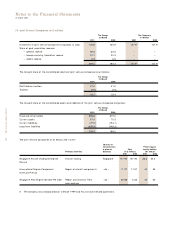
26 Analysis of Capital Expenditure Cash Flow (in $ million)
The Group The Company
2000 - 2001 1999 - 2000 2000 - 2001 1999 - 2000
Purchase of fixed assets 2,589.0 1,911.5 2,336.1 1,636.2
Less: Assets acquired under credit terms (33.5) (3.9) – (1.6)
Cash invested in capital expenditure 2,555.5 1,907.6 2,336.1 1,634.6