Singapore Airlines 2001 Annual Report Download - page 37
Download and view the complete annual report
Please find page 37 of the 2001 Singapore Airlines annual report below. You can navigate through the pages in the report by either clicking on the pages listed below, or by using the keyword search tool below to find specific information within the annual report.
35 SIA annual report 00/01
Financial Review
REVENUE
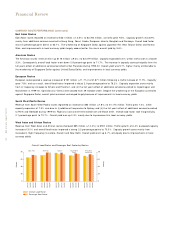
The Airline Company’s revenue for 2000-01 was $9,230 million, an increase of $889 million (+10.7% ) over 1999-00. The SIA Group’s
revenue was $933 million (+10.3% ) higher at $9,951 million.
The Airline Company’s revenue increase was due to:-
$ million
6.6% growth in capacity + 532
0.8 percentage point increase in overall load factor +95
+ 627
2.9% increase in overall yield + 247
Increase in scheduled services revenue + 874
Increase in non-scheduled services and incidental revenue + 15
+ 889
The strengthening of the Singapore Dollar against the bulk of foreign currencies making up the Airline Company’s revenue resulted in a
loss of $125 million.
80
75
70
65
60
55
75
65
55
45
35
Yield, Unit Cost and Load Factors
Cents / tkm
Percent
1996/97 1997/98 1998/99 1999/00 2000/01
Overall Yield (¢/ltk)
Overall Load Factor (%)
Breakeven Load Factor (%)
Unit Cost (¢/ctk)
■■■■ Available Capacity (tkm)
Load Carried (tkm)
■■■■ Excess Baggage and Mail
■■■■ Cargo
■■■■ Passenger
Passenger Seat Factor (%)
Overall Load Factor (%)
30,000
20,000
10,000
0
80
70
60
50
Available Capacity, Load Carried
and Load Factors
Percent
Tkm (Million)
1996/97 1997/98 1998/99 1999/00 2000/01
10,000
8,000
6,000
4,000
2,000
10,000
8,000
6,000
4,000
2,000
0
Revenue
$ Million
$ Million
1996/97 1997/98 1998/99 1999/00 2000/01
■■■■ Group
■■■■ Company


