Singapore Airlines 2001 Annual Report Download - page 49
Download and view the complete annual report
Please find page 49 of the 2001 Singapore Airlines annual report below. You can navigate through the pages in the report by either clicking on the pages listed below, or by using the keyword search tool below to find specific information within the annual report.-
 1
1 -
2
-
3
-
4
-
5
-
6
-
7
-
8
-
9
-
10
-
11
-
12
-
13
-
14
-
15
-
16
-
17
-
18
-
19
-
20
-
21
-
22
-
23
-
24
-
25
-
26
-
27
-
28
-
29
-
30
-
31
-
32
-
33
-
34
-
35
-
36
-
37
-
38
-
 39
39 -
 40
40 -
 41
41 -
 42
42 -
 43
43 -
 44
44 -
 45
45 -
 46
46 -
 47
47 -
 48
48 -
 49
49 -
 50
50 -
 51
51 -
 52
52 -
 53
53 -
 54
54 -
 55
55 -
 56
56 -
 57
57 -
 58
58 -
 59
59 -
60
-
61
-
62
-
63
-
64
-
65
-
66
-
67
-
68
-
69
-
70
-
71
-
72
-
73
-
74
-
75
-
76
-
77
-
78
-
79
-
80
-
81
-
82
-
83
-
84
-
85
-
86
-
87
-
88
-
89
-
90
-
91
-
92
-
93
-
94
-
95
-
96
-
97
-
98
-
99
-
100
-
101
-
102
-
103
-
104
-
105
-
106
-
107
-
108
-
109
-
110
 |
 |

47 SIA annual report 00/01
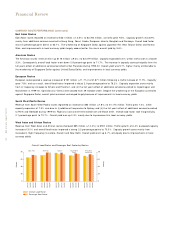
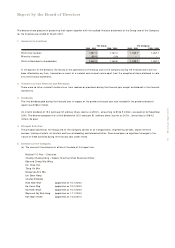
Financial Review
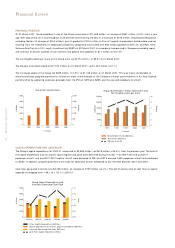
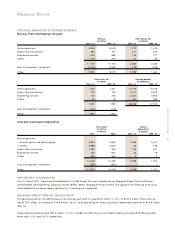
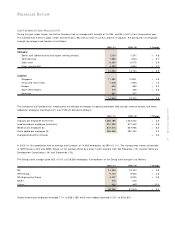
STAFF STRENGTH AND PRODUCTIVITY
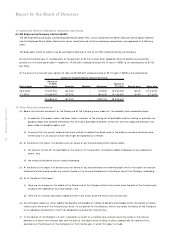
During the year under review, the Airline Company had an average staff strength of 14,254, up 534 (+3.9% ) from the previous year.
The increase was mainly in cabin (+361) and technical (+85) crew to cater to a 6.6% growth in capacity. The distribution of employee
strength by category and location is as follows:-
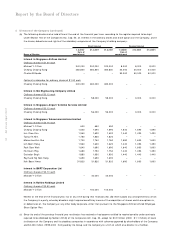
2000 - 01 1999 - 00 % Change
Category
Senior staff (administrative and higher ranking officers) 1,304 1,247 + 4.6
Technical crew 1,589 1,504 + 5.7
Cabin crew 6,436 6,075 + 5.9
Other ground staff 4,925 4,894 + 0.7
14,254 13,720 + 3.9
Location
Singapore 11,282 10,801 + 4.5
Africa and rest of Asia 1,618 1,594 + 1.5
Europe 603 585 + 3.0
South West Pacific 419 408 + 2.6
Americas 332 332 –
14,254 13,720 + 3.9
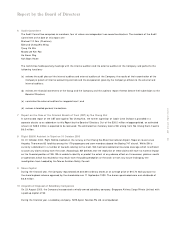
The Company’s staff productivity, measured by the average of changes in capacity produced, load carried, revenue earned, and value
added per employee, improved 2.6% over 1999-00 derived as follows:-
2000 - 01 1999 - 00 % Change
Capacity per employee (tonne-km) 1,265,189 1,233,032 + 2.6
Load carried per employee (tonne-km) 910,993 877,434 + 3.8
Revenue per employee ($) 647,516 607,966 + 6.5
Value added per employee ($) 284,369 290,160 - 2.4
Average productivity increase + 2.6
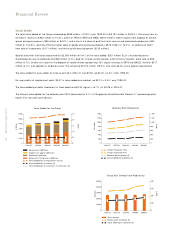
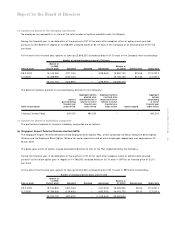
In 2000-01, the subsidiaries had an average staff strength of 14,082 employees, up 289 (+2.1% ). The increase was mainly attributable
to SATS Group (+224) and SIAEC Group (+112), partially offset by a drop in staff strength from SIA Properties (-19), Aviation Software
Development Consultancy (-14) and Tradewinds (-10).
The Group’s staff strength grew 823 (+3.0% ) to 28,336 employees. A breakdown of the Group staff strength is as follows:-
2000 - 01 1999 - 00 % Change
SIA 14,254 13,720 + 3.9
SATS Group 9,147 8,923 + 2.5
SIA Engineering Group 4,037 3,925 + 2.9
SilkAir 476 476 –
Others 422 469 - 10.0
28,336 27,513 + 3.0
Group revenue per employee increased 7.1% to $351,189, while value added improved 10.5% to $182,831.