Sharp 2010 Annual Report Download - page 60
Download and view the complete annual report
Please find page 60 of the 2010 Sharp annual report below. You can navigate through the pages in the report by either clicking on the pages listed below, or by using the keyword search tool below to find specific information within the annual report.-
 1
1 -
2
-
3
-
4
-
5
-
6
-
7
-
8
-
9
-
10
-
11
-
12
-
13
-
14
-
15
-
16
-
17
-
18
-
19
-
20
-
21
-
22
-
23
-
24
-
25
-
26
-
27
-
28
-
29
-
30
-
31
-
32
-
33
-
34
-
35
-
36
-
37
-
38
-
39
-
40
-
41
-
42
-
43
-
44
-
45
-
46
-
47
-
48
-
49
-
 50
50 -
 51
51 -
 52
52 -
 53
53 -
 54
54 -
 55
55 -
 56
56 -
 57
57 -
 58
58 -
 59
59 -
 60
60 -
 61
61 -
 62
62 -
 63
63 -
 64
64 -
 65
65 -
 66
66 -
 67
67 -
 68
68
 |
 |

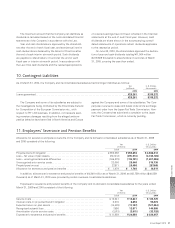
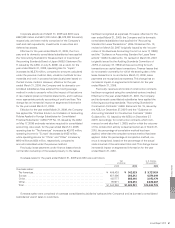
The discount rate used by the Company and its domestic
consolidated subsidiaries was 2.5% for the years ended March
31, 2009 and 2010. The rate of expected return on plan assets
used by the Company and its domestic consolidated subsidiar-
ies for the years ended March 31, 2009 and 2010 was 4.5%.
The estimated amount of all retirement benefits to be
paid at future retirement dates is allocated to each service
year mainly based on points.
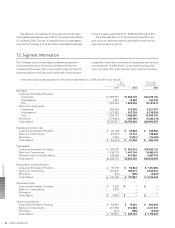
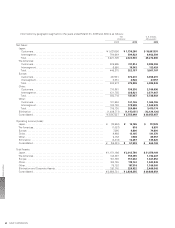
12. Segment Information
The Company and its consolidated subsidiaries operate in
Consumer/Information Products business and Electronic
Components business. The Consumer/Information Products
business segment includes audio-visual and communication
equipment, health and environmental equipment and informa-
tion equipment. The Electronic Components business seg-
ment includes LCDs, solar cells and other electronic devices.
Information by business segment for the years ended March 31, 2009 and 2010 is as follows:
Yen
(millions)
U.S. Dollars
(thousands)
2009 2010 2010
Net Sales:
Consumer/Information Products:
Customers. . . . . . . . . . . . . . . . . . . . . . . . . . . . . . . . . . . . . . . . . . . . . . . . . . . . ¥1,898,967 ¥1,843,139 $20,034,120
Intersegment. . . . . . . . . . . . . . . . . . . . . . . . . . . . . . . . . . . . . . . . . . . . . . . . . . 7,622 15,069 163,793
Total . . . . . . . . . . . . . . . . . . . . . . . . . . . . . . . . . . . . . . . . . . . . . . . . . . . . . . . . . 1,906,589 1,858,208 20,197,913
Electronic Components:
Customers. . . . . . . . . . . . . . . . . . . . . . . . . . . . . . . . . . . . . . . . . . . . . . . . . . . . 948,260 912,809 9,921,837
Intersegment. . . . . . . . . . . . . . . . . . . . . . . . . . . . . . . . . . . . . . . . . . . . . . . . . . 571,902 472,726 5,138,326
Total . . . . . . . . . . . . . . . . . . . . . . . . . . . . . . . . . . . . . . . . . . . . . . . . . . . . . . . . . 1,520,162 1,385,535 15,060,163
Elimination . . . . . . . . . . . . . . . . . . . . . . . . . . . . . . . . . . . . . . . . . . . . . . . . . . . . . (579,524) (487,795) (5,302,119)
Consolidated . . . . . . . . . . . . . . . . . . . . . . . . . . . . . . . . . . . . . . . . . . . . . . . . . . . . ¥2,847,227 ¥2,755,948 $29,955,957
Operating Income (Loss):
Consumer/Information Products . . . . . . . . . . . . . . . . . . . . . . . . . . . . . . . . . . . . . ¥ (33,769) ¥ 33,983 $ 369,380
Electronic Components. . . . . . . . . . . . . . . . . . . . . . . . . . . . . . . . . . . . . . . . . . . . (23,975) 20,134 218,848
Elimination . . . . . . . . . . . . . . . . . . . . . . . . . . . . . . . . . . . . . . . . . . . . . . . . . . . . . 2,263 (2,214) (24,065)
Consolidated . . . . . . . . . . . . . . . . . . . . . . . . . . . . . . . . . . . . . . . . . . . . . . . . . . . . ¥ (55,481) ¥ 51,903 $ 564,163
Total Assets:
Consumer/Information Products . . . . . . . . . . . . . . . . . . . . . . . . . . . . . . . . . . . . . ¥ 869,392 ¥ 953,316 $10,362,130
Electronic Components. . . . . . . . . . . . . . . . . . . . . . . . . . . . . . . . . . . . . . . . . . . . 1,398,773 1,481,109 16,099,011
Elimination and Corporate Assets . . . . . . . . . . . . . . . . . . . . . . . . . . . . . . . . . . . . 420,556 401,830 4,367,718
Consolidated . . . . . . . . . . . . . . . . . . . . . . . . . . . . . . . . . . . . . . . . . . . . . . . . . . . . ¥2,688,721 ¥2,836,255 $30,828,859
Depreciation and Amortization:
Consumer/Information Products . . . . . . . . . . . . . . . . . . . . . . . . . . . . . . . . . . . . . ¥ 115,798 ¥ 93,643 $ 1,017,859
Electronic Components. . . . . . . . . . . . . . . . . . . . . . . . . . . . . . . . . . . . . . . . . . . . 200,920 184,519 2,005,641
Elimination . . . . . . . . . . . . . . . . . . . . . . . . . . . . . . . . . . . . . . . . . . . . . . . . . . . . . (919) (905) (9,837)
Consolidated . . . . . . . . . . . . . . . . . . . . . . . . . . . . . . . . . . . . . . . . . . . . . . . . . . . . ¥ 315,799 ¥ 277,257 $ 3,013,663
Impairment Loss:
Consumer/Information Products . . . . . . . . . . . . . . . . . . . . . . . . . . . . . . . . . . . . . ¥ 3,506 ¥ – $ –
Electronic Components. . . . . . . . . . . . . . . . . . . . . . . . . . . . . . . . . . . . . . . . . . . . 5,962 – –
Elimination . . . . . . . . . . . . . . . . . . . . . . . . . . . . . . . . . . . . . . . . . . . . . . . . . . . . . – – –
Consolidated . . . . . . . . . . . . . . . . . . . . . . . . . . . . . . . . . . . . . . . . . . . . . . . . . . . . ¥ 9,468 ¥ – $ –
Capital Expenditures:
Consumer/Information Products . . . . . . . . . . . . . . . . . . . . . . . . . . . . . . . . . . . . . ¥ 106,855 ¥ 74,024 $ 804,609
Electronic Components. . . . . . . . . . . . . . . . . . . . . . . . . . . . . . . . . . . . . . . . . . . . 221,386 212,683 2,311,772
Elimination . . . . . . . . . . . . . . . . . . . . . . . . . . . . . . . . . . . . . . . . . . . . . . . . . . . . . (407) (584) (6,348)
Consolidated . . . . . . . . . . . . . . . . . . . . . . . . . . . . . . . . . . . . . . . . . . . . . . . . . . . . ¥ 327,834 ¥ 286,123 $ 3,110,033
Financial Section
SHARP CORPORATION58