Sharp 2010 Annual Report Download - page 48
Download and view the complete annual report
Please find page 48 of the 2010 Sharp annual report below. You can navigate through the pages in the report by either clicking on the pages listed below, or by using the keyword search tool below to find specific information within the annual report.-
 1
1 -
2
-
3
-
4
-
5
-
6
-
7
-
8
-
9
-
10
-
11
-
12
-
13
-
14
-
15
-
16
-
17
-
18
-
19
-
20
-
21
-
22
-
23
-
24
-
25
-
26
-
27
-
28
-
29
-
30
-
31
-
32
-
33
-
34
-
35
-
36
-
37
-
 38
38 -
 39
39 -
 40
40 -
 41
41 -
 42
42 -
 43
43 -
 44
44 -
 45
45 -
 46
46 -
 47
47 -
 48
48 -
 49
49 -
 50
50 -
 51
51 -
 52
52 -
 53
53 -
 54
54 -
 55
55 -
 56
56 -
 57
57 -
 58
58 -
59
-
60
-
61
-
62
-
63
-
64
-
65
-
66
-
67
-
68
 |
 |

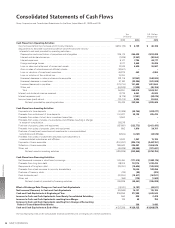
Consolidated Statements of Cash Flows
Sharp Corporation and Consolidated Subsidiaries for the Years Ended March 31, 2009 and 2010
Yen
(millions)
U.S. Dollars
(thousands)
2009 2010 2010
Cash Flows from Operating Activities:
Income (loss) before income taxes and minority interests . . . . . . . . . . . . . . . . . . . . . . . . . . . . . . . ¥(204,139) ¥ 6,139 $ 66,728
Adjustments to reconcile income (loss) before income taxes and minority
interests to net cash provided by operating activities—
Depreciation and amortization of properties and intangibles . . . . . . . . . . . . . . . . . . . . . . . . . . . 305,115 264,429 2,874,228
Interest and dividends income . . . . . . . . . . . . . . . . . . . . . . . . . . . . . . . . . . . . . . . . . . . . . . . . . . (7,009) (3,547) (38,554)
Interest expenses . . . . . . . . . . . . . . . . . . . . . . . . . . . . . . . . . . . . . . . . . . . . . . . . . . . . . . . . . . . . 9,147 7,794 84,717
Foreign exchange losses . . . . . . . . . . . . . . . . . . . . . . . . . . . . . . . . . . . . . . . . . . . . . . . . . . . . . . . 2,217 3,609 39,229
Loss on sales and retirement of noncurrent assets . . . . . . . . . . . . . . . . . . . . . . . . . . . . . . . . . . 10,576 4,930 53,587
Gain on sales of subsidiaries and affiliate’s stocks . . . . . . . . . . . . . . . . . . . . . . . . . . . . . . . . . . . (18,521) – –
Loss on valuation of investment securities . . . . . . . . . . . . . . . . . . . . . . . . . . . . . . . . . . . . . . . . . 49,875 442 4,804
Loss on violation of the antitrust law. . . . . . . . . . . . . . . . . . . . . . . . . . . . . . . . . . . . . . . . . . . . . . 12,004 – –
(Increase) decrease in notes and accounts receivable . . . . . . . . . . . . . . . . . . . . . . . . . . . . . . . . 102,119 (87,301) (948,924)
(Increase) decrease in inventories. . . . . . . . . . . . . . . . . . . . . . . . . . . . . . . . . . . . . . . . . . . . . . . . 27,180 (22,250) (241,848)
Increase (decrease) in payables. . . . . . . . . . . . . . . . . . . . . . . . . . . . . . . . . . . . . . . . . . . . . . . . . . (175,734) 131,698 1,431,500
Other, net . . . . . . . . . . . . . . . . . . . . . . . . . . . . . . . . . . . . . . . . . . . . . . . . . . . . . . . . . . . . . . . . . . (53,539) (7,425) (80,706)
Total . . . . . . . . . . . . . . . . . . . . . . . . . . . . . . . . . . . . . . . . . . . . . . . . . . . . . . . . . . . . . . . . . . . . . 59,291 298,518 3,244,761
Interest and dividends income received . . . . . . . . . . . . . . . . . . . . . . . . . . . . . . . . . . . . . . . . . . . . . 8,735 4,041 43,924
Interest expenses paid . . . . . . . . . . . . . . . . . . . . . . . . . . . . . . . . . . . . . . . . . . . . . . . . . . . . . . . . . . (9,179) (7,551) (82,076)
Income taxes (paid) refund . . . . . . . . . . . . . . . . . . . . . . . . . . . . . . . . . . . . . . . . . . . . . . . . . . . . . . . (33,412) 8,556 93,000
Net cash provided by operating activities. . . . . . . . . . . . . . . . . . . . . . . . . . . . . . . . . . . . . . . 25,435 303,564 3,299,609
Cash Flows from Investing Activities:
Payments into time deposits . . . . . . . . . . . . . . . . . . . . . . . . . . . . . . . . . . . . . . . . . . . . . . . . . . . . . (74,089) (39,764) (432,217)
Proceeds from withdrawal of time deposits. . . . . . . . . . . . . . . . . . . . . . . . . . . . . . . . . . . . . . . . . . 104,027 39,138 425,413
Proceeds from sales of short-term investment securities . . . . . . . . . . . . . . . . . . . . . . . . . . . . . . . 2,500 – –
Proceeds from sales of stocks of subsidiaries and affiliates resulting in change
in scope of consolidation. . . . . . . . . . . . . . . . . . . . . . . . . . . . . . . . . . . . . . . . . . . . . . . . . . . . . . . . 28,278 – –
Purchase of property, plant and equipment . . . . . . . . . . . . . . . . . . . . . . . . . . . . . . . . . . . . . . . . . . (237,801) (222,772) (2,421,435)
Proceeds from sales of property, plant and equipment . . . . . . . . . . . . . . . . . . . . . . . . . . . . . . . . . 893 1,910 20,761
Purchase of investment securities and investments in nonconsolidated
subsidiaries and affiliates . . . . . . . . . . . . . . . . . . . . . . . . . . . . . . . . . . . . . . . . . . . . . . . . . . . . . . . (5,504) (4,101) (44,576)
Proceeds from sales of investment securities and investments in
nonconsolidated subsidiaries and affiliates . . . . . . . . . . . . . . . . . . . . . . . . . . . . . . . . . . . . . . . . . . 3,843 1,207 13,120
Payments of loans receivable . . . . . . . . . . . . . . . . . . . . . . . . . . . . . . . . . . . . . . . . . . . . . . . . . . . . . (304,267) (226,114) (2,457,761)
Collection of loans receivable . . . . . . . . . . . . . . . . . . . . . . . . . . . . . . . . . . . . . . . . . . . . . . . . . . . . . 306,520 226,281 2,459,576
Other, net . . . . . . . . . . . . . . . . . . . . . . . . . . . . . . . . . . . . . . . . . . . . . . . . . . . . . . . . . . . . . . . . . . . . (46,629) (29,590) (321,631)
Net cash used in investing activities . . . . . . . . . . . . . . . . . . . . . . . . . . . . . . . . . . . . . . . . . . (222,229) (253,805) (2,758,750)
Cash Flows from Financing Activities:
Net (decrease) increase in short-term borrowings . . . . . . . . . . . . . . . . . . . . . . . . . . . . . . . . . . . . . 163,494 (171,315) (1,862,119)
Proceeds from long-term debt . . . . . . . . . . . . . . . . . . . . . . . . . . . . . . . . . . . . . . . . . . . . . . . . . . . . 88,912 157,174 1,708,413
Repayments of long-term debt . . . . . . . . . . . . . . . . . . . . . . . . . . . . . . . . . . . . . . . . . . . . . . . . . . . . (35,031) (15,634) (169,935)
Proceeds from stock issuance to minority shareholders . . . . . . . . . . . . . . . . . . . . . . . . . . . . . . . . – 10,000 108,696
Purchase of treasury stock . . . . . . . . . . . . . . . . . . . . . . . . . . . . . . . . . . . . . . . . . . . . . . . . . . . . . . . (176) (80) (870)
Cash dividends paid . . . . . . . . . . . . . . . . . . . . . . . . . . . . . . . . . . . . . . . . . . . . . . . . . . . . . . . . . . . . (30,804) (15,411) (167,511)
Other, net . . . . . . . . . . . . . . . . . . . . . . . . . . . . . . . . . . . . . . . . . . . . . . . . . . . . . . . . . . . . . . . . . . . . (166) (175) (1,902)
Net cash (used in) provided by financing activities. . . . . . . . . . . . . . . . . . . . . . . . . . . . . . . . 186,229 (35,441) (385,228)
Effect of Exchange Rate Change on Cash and Cash Equivalents . . . . . . . . . . . . . . . . . . . . . . . . . (12,001) (4,187) (45,511)
Net Increase (Decrease) in Cash and Cash Equivalents . . . . . . . . . . . . . . . . . . . . . . . . . . . . . . . . (22,566) 10,131 110,120
Cash and Cash Equivalents at Beginning of Year. . . . . . . . . . . . . . . . . . . . . . . . . . . . . . . . . . . . . . 339,266 317,358 3,449,543
Increase in Cash and Cash Equivalents from Newly Consolidated Subsidiary . . . . . . . . . . . . . 550 228 2,478
Increase in Cash and Cash Equivalents resulting from Merger . . . . . . . . . . . . . . . . . . . . . . . . . . 108 69 750
Increase in Cash and Cash Equivalents resulting from Change of Accounting
Period of Consolidated Subsidiaries . . . . . . . . . . . . . . . . . . . . . . . . . . . . . . . . . . . . . . . . . . . . . . . – 339 3,685
Cash and Cash Equivalents at End of Year . . . . . . . . . . . . . . . . . . . . . . . . . . . . . . . . . . . . . . . . . . . ¥ 317,358 ¥ 328,125 $ 3,566,576
The accompanying notes to the consolidated financial statements are an integral part of these statements.
Financial Section
SHARP CORPORATION46