Sharp 2010 Annual Report Download - page 43
Download and view the complete annual report
Please find page 43 of the 2010 Sharp annual report below. You can navigate through the pages in the report by either clicking on the pages listed below, or by using the keyword search tool below to find specific information within the annual report.-
 1
1 -
2
-
3
-
4
-
5
-
6
-
7
-
8
-
9
-
10
-
11
-
12
-
13
-
14
-
15
-
16
-
17
-
18
-
19
-
20
-
21
-
22
-
23
-
24
-
25
-
26
-
27
-
28
-
29
-
30
-
31
-
32
-
 33
33 -
 34
34 -
 35
35 -
 36
36 -
 37
37 -
 38
38 -
 39
39 -
 40
40 -
 41
41 -
 42
42 -
 43
43 -
 44
44 -
 45
45 -
 46
46 -
 47
47 -
 48
48 -
 49
49 -
 50
50 -
 51
51 -
 52
52 -
 53
53 -
54
-
55
-
56
-
57
-
58
-
59
-
60
-
61
-
62
-
63
-
64
-
65
-
66
-
67
-
68
 |
 |

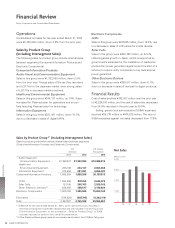
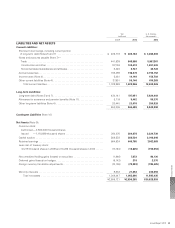
decreased by ¥169,671 million to ¥165,755 million, and
current portion of long-term debt increased by ¥57,138
million to ¥65,977 million. Notes and accounts payable
were ¥653,153 million, a decrease of ¥100,668 million.
Long-term liabilities increased by ¥96,184 million to
¥546,489 million. This was mainly due to an increase of
¥93,810 million in long-term debt.
Interest-bearing debt was ¥820,135 million, a decrease
of ¥9,616 million.
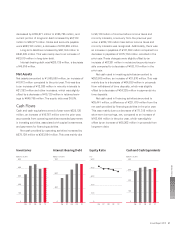
Net Assets
Net assets amounted to ¥1,065,860 million, an increase of
¥17,413 million compared to the prior year. This was due
to an increase of ¥12,020 million in minority interests to
¥21,353 million and other increases, which was slightly
offset by a decrease of ¥15,129 million in retained earn-
ings to ¥649,795 million. The equity ratio was 36.8%.
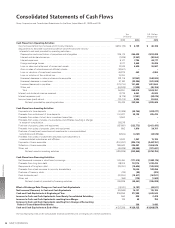
Cash Flows
Cash and cash equivalents at end of year were ¥328,125
million, an increase of ¥10,767 million over the prior year,
as proceeds from operating activities exceeded payments
in investing activities, associated with capital investments
and payments for financing activities.
Net cash provided by operating activities increased by
¥278,129 million to ¥303,564 million. This was mainly due
to ¥6,139 million of income before income taxes and
minority interests, a recovery from the previous year
when a ¥204,139 million loss before income taxes and
minority interests was recognized. Additionally, there was
an increase in payables of ¥131,698 million compared to a
decrease in payables of ¥175,734 million recorded in the
prior year. These changes were slightly offset by an
increase of ¥87,301 million in notes and accounts receiv-
able compared to a decrease of ¥102,119 million in the
prior year.
Net cash used in investing activities amounted to
¥253,805 million, an increase of ¥31,576 million. This was
mainly due to a decrease of ¥64,889 million in proceeds
from withdrawal of time deposits, which was slightly
offset by a decrease of ¥34,325 million in payments into
time deposits.
Net cash used in financing activities amounted to
¥35,441 million, a difference of ¥221,670 million from the
net cash provided by financing activities in the prior year.
This was mainly due to a decrease of ¥171,315 million in
short-term borrowings, net, compared to an increase of
¥163,494 million in the prior year, which was slightly
offset by an increase of ¥68,262 million in proceeds from
long-term debt.
Inventories
(billions of yen)
Interest-Bearing Debt
(billions of yen)
Equity Ratio
(%)
Cash and Cash Equivalents
(billions of yen)
500
0
08 09 100706
400
300
200
100
900
0
08 09 100706
600
300
50.0
0
08 09 100706
40.0
30.0
20.0
10.0
400
0
08 09 100706
300
200
100
Financial Section
Annual Report 2010 41