Sharp 2010 Annual Report Download - page 40
Download and view the complete annual report
Please find page 40 of the 2010 Sharp annual report below. You can navigate through the pages in the report by either clicking on the pages listed below, or by using the keyword search tool below to find specific information within the annual report.-
 1
1 -
2
-
3
-
4
-
5
-
6
-
7
-
8
-
9
-
10
-
11
-
12
-
13
-
14
-
15
-
16
-
17
-
18
-
19
-
20
-
21
-
22
-
23
-
24
-
25
-
26
-
27
-
28
-
29
-
 30
30 -
 31
31 -
 32
32 -
 33
33 -
 34
34 -
 35
35 -
 36
36 -
 37
37 -
 38
38 -
 39
39 -
 40
40 -
 41
41 -
 42
42 -
 43
43 -
 44
44 -
 45
45 -
 46
46 -
 47
47 -
 48
48 -
 49
49 -
 50
50 -
51
-
52
-
53
-
54
-
55
-
56
-
57
-
58
-
59
-
60
-
61
-
62
-
63
-
64
-
65
-
66
-
67
-
68
 |
 |

Financial Review
Sharp Corporation and Consolidated Subsidiaries
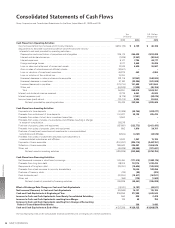
Operations
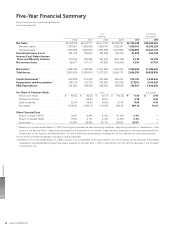
Consolidated net sales for the year ended March 31, 2010
were ¥2,755,948 million, down 3.2% from the prior year.
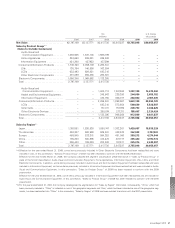
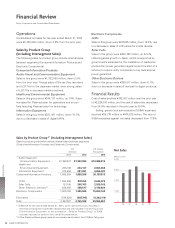
Sales by Product Group
(Including Intersegment Sales)
The following sales by product group include internal sales
between segments (Consumer/Information Products and
Electronic Components).
Consumer/Information Products
Audio-Visual and Communication Equipment
Sales in this group were ¥1,332,980 million, down 2.5%
from the prior year. Though sales of Blu-ray Disc recorders
and LCD TVs for the Japanese market were strong, sales
of LCD TVs in overseas markets declined.
Health and Environmental Equipment
Sales in this group were ¥244,137 million, up 7.9%. Sales
increased for Plasmacluster Ion generators and air puri-
fiers featuring Plasmacluster Ion technology.
Information Equipment
Sales in this group were ¥281,091 million, down 10.1%,
due to a decrease in sales of digital MFPs.
Ye n
(millions)
U.S. Dollars
(thousands)
2009 2010 2010
Audio-Visual and
Communication Equipment. . . . . ¥1,367,847 ¥1,332,980 $14,488,913
Health and
Environmental Equipment. . . . . . 226,186 244,137 2,653,663
Information Equipment . . . . . . . . . 312,556 281,091 3,055,337
Consumer/Information Products. . . . 1,906,589 1,858,208 20,197,913
LCDs . . . . . . . . . . . . . . . . . . . . . . . 1,054,559 887,255 9,644,076
Solar Cells . . . . . . . . . . . . . . . . . . . 157,145 208,763 2,269,163
Other Electronic Devices*2. . . . . . 308,458 289,517 3,146,924
Electronic Components . . . . . . . . . . 1,520,162 1,385,535 15,060,163
Elimination . . . . . . . . . . . . . . . . . . . . (579,524) (487,795) (5,302,119)
Total . . . . . . . . . . . . . . . . . . . . . . . . . 2,847,227 2,755,948 29,955,957
*1 Effective for the year ended March 31, 2010, some items previously included in
Information Equipment have been reclassified and are included in Audio-Visual and
Communication Equipment. In this connection, “Sales by Product Group” of 2009
has been restated to conform with the 2010 presentation.
*2 Other Electronic Device group’s sales do not include internal sales to the LCD/Solar Cell groups.
Sales by Product Group*1 (Including Intersegment Sales)
Sales by product group below include internal sales between segments
(Consumer/Information Products and Electronic Components).
Net Sales
(billions of yen)
4,000
0
08 09 100706
3,000
2,000
1,000
Electronic Components
LCDs
Sales in this group were ¥887,255 million, down 15.9%, due
to a decrease in sales of LCD panels for mobile devices.
Solar Cells
Sales in this group were ¥208,763 million, up 32.8%,
reflecting sales growth in Japan, which is supported by
government’s subsidies for the installation of residential
photovoltaic power generation systems and the start of a
scheme to require utility companies to buy back surplus
power generated.
Other Electronic Devices
Sales in this group were ¥289,517 million, down 6.1%,
due to a decrease in sales of devices for digital products.
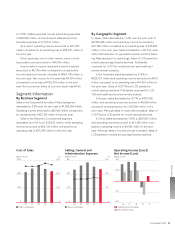
Financial Results
Cost of sales declined ¥162,887 million over the prior year
to ¥2,229,510 million, and the cost of sales ratio decreased
from 84.0% recorded in the prior year to 80.9%.
Selling, general and administrative (SG&A) expenses
declined ¥35,776 million to ¥474,535 million. The ratio of
SG&A expenses against net sales decreased from 17.9%
Financial Section
SHARP CORPORATION38