Sharp 2010 Annual Report Download - page 44
Download and view the complete annual report
Please find page 44 of the 2010 Sharp annual report below. You can navigate through the pages in the report by either clicking on the pages listed below, or by using the keyword search tool below to find specific information within the annual report.-
 1
1 -
2
-
3
-
4
-
5
-
6
-
7
-
8
-
9
-
10
-
11
-
12
-
13
-
14
-
15
-
16
-
17
-
18
-
19
-
20
-
21
-
22
-
23
-
24
-
25
-
26
-
27
-
28
-
29
-
30
-
31
-
32
-
33
-
 34
34 -
 35
35 -
 36
36 -
 37
37 -
 38
38 -
 39
39 -
 40
40 -
 41
41 -
 42
42 -
 43
43 -
 44
44 -
 45
45 -
 46
46 -
 47
47 -
 48
48 -
 49
49 -
 50
50 -
 51
51 -
 52
52 -
 53
53 -
 54
54 -
55
-
56
-
57
-
58
-
59
-
60
-
61
-
62
-
63
-
64
-
65
-
66
-
67
-
68
 |
 |

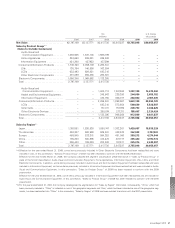
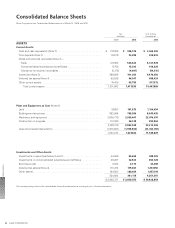
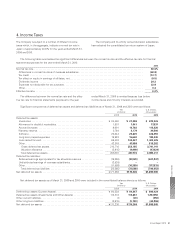
Consolidated Balance Sheets
Sharp Corporation and Consolidated Subsidiaries as of March 31, 2009 and 2010
Yen
(millions)
U.S. Dollars
(thousands)
2009 2010 2010
ASSETS
Current Assets:
Cash and cash equivalents (Note 7) . . . . . . . . . . . . . . . . . . . . . . . . . . . . . . . . . ¥ 317,358 ¥ 328,125 $ 3,566,576
Time deposits (Note 7) . . . . . . . . . . . . . . . . . . . . . . . . . . . . . . . . . . . . . . . . . . . 19,579 20,289 220,533
Notes and accounts receivable (Note 7)—
Trade . . . . . . . . . . . . . . . . . . . . . . . . . . . . . . . . . . . . . . . . . . . . . . . . . . . . . . . 417,483 526,422 5,721,978
Nonconsolidated subsidiaries and affiliates. . . . . . . . . . . . . . . . . . . . . . . . . . 17,756 15,293 166,228
Allowance for doubtful receivables . . . . . . . . . . . . . . . . . . . . . . . . . . . . . . . . (5,175) (4,997) (54,315)
Inventories (Note 3). . . . . . . . . . . . . . . . . . . . . . . . . . . . . . . . . . . . . . . . . . . . . . 399,985 411,263 4,470,250
Deferred tax assets (Note 4). . . . . . . . . . . . . . . . . . . . . . . . . . . . . . . . . . . . . . . 60,538 64,347 699,424
Other current assets. . . . . . . . . . . . . . . . . . . . . . . . . . . . . . . . . . . . . . . . . . . . . 74,438 56,793 617,315
Total current assets . . . . . . . . . . . . . . . . . . . . . . . . . . . . . . . . . . . . . . . . . . 1,301,962 1,417,535 15,407,989
Plant and Equipment, at Cost (Note 6):
Land . . . . . . . . . . . . . . . . . . . . . . . . . . . . . . . . . . . . . . . . . . . . . . . . . . . . . . . . . 97,653 101,573 1,104,054
Buildings and structures . . . . . . . . . . . . . . . . . . . . . . . . . . . . . . . . . . . . . . . . . . 692,894 795,380 8,645,435
Machinery and equipment . . . . . . . . . . . . . . . . . . . . . . . . . . . . . . . . . . . . . . . . 2,006,779 2,030,447 22,070,076
Construction in progress. . . . . . . . . . . . . . . . . . . . . . . . . . . . . . . . . . . . . . . . . . 110,390 36,138 392,804
2,907,716 2,963,538 32,212,369
Less accumulated depreciation . . . . . . . . . . . . . . . . . . . . . . . . . . . . . . . . . . . . (1,875,641) (1,935,934) (21,042,760)
1,032,075 1,027,604 11,169,609
Investments and Other Assets:
Investments in securities (Notes 2 and 7). . . . . . . . . . . . . . . . . . . . . . . . . . . . . 44,606 59,669 648,576
Investments in nonconsolidated subsidiaries and affiliates . . . . . . . . . . . . . . . 28,287 32,543 353,728
Bond issue cost . . . . . . . . . . . . . . . . . . . . . . . . . . . . . . . . . . . . . . . . . . . . . . . . 3,524 3,173 34,489
Deferred tax assets (Note 4). . . . . . . . . . . . . . . . . . . . . . . . . . . . . . . . . . . . . . . 113,314 115,667 1,257,250
Other assets . . . . . . . . . . . . . . . . . . . . . . . . . . . . . . . . . . . . . . . . . . . . . . . . . . . 164,953 180,064 1,957,218
354,684 391,116 4,251,261
¥ 2,688,721 ¥ 2,836,255 $ 30,828,859
The accompanying notes to the consolidated financial statements are an integral part of these statements.
Financial Section
SHARP CORPORATION42