Sharp 2010 Annual Report Download - page 20
Download and view the complete annual report
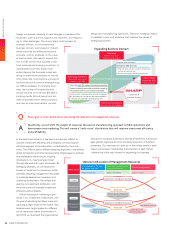
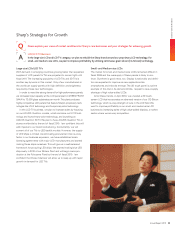
Please find page 20 of the 2010 Sharp annual report below. You can navigate through the pages in the report by either clicking on the pages listed below, or by using the keyword search tool below to find specific information within the annual report.-
 1
1 -
2
-
3
-
4
-
5
-
6
-
7
-
8
-
9
-
 10
10 -
 11
11 -
 12
12 -
 13
13 -
 14
14 -
 15
15 -
 16
16 -
 17
17 -
 18
18 -
 19
19 -
 20
20 -
 21
21 -
 22
22 -
 23
23 -
 24
24 -
 25
25 -
 26
26 -
 27
27 -
 28
28 -
 29
29 -
 30
30 -
31
-
32
-
33
-
34
-
35
-
36
-
37
-
38
-
39
-
40
-
41
-
42
-
43
-
44
-
45
-
46
-
47
-
48
-
49
-
50
-
51
-
52
-
53
-
54
-
55
-
56
-
57
-
58
-
59
-
60
-
61
-
62
-
63
-
64
-
65
-
66
-
67
-
68
 |
 |

Sales
(billions of yen)
Consumer/Information Products
Total Assets
(billions of yen)
Operating Income (Loss)
(billions of yen)
Capital Investment
(billions of yen)
Main Products
LCD color televisions, color televi-
sions, projectors, DVD recorders,
Blu-ray Disc recorders, Blu-ray Disc
players, mobile phones, PHS (per-
sonal handy-phone system) termi-
nals, mobile communications
handsets, personal computers,
electronic dictionaries, calculators,
facsimiles, telephones
Main Products
Refrigerators, superheated steam
ovens, microwave ovens, air condi-
tioners, washing machines, vacuum
cleaners, air purifiers, dehumidi-
fiers, humidifiers, electric heaters,
small cooking appliances, Plasma-
cluster Ion generators, LED lights,
solar-powered LED lights
Main Products
POS systems, handy data termi-
nals, electronic cash registers, LCD
color monitors, information dis-
plays, digital MFPs (multi-function
printers), options and consumables,
software, FA equipment, ultrasonic
cleaners
· Sales shown on pages 18-19 include internal sales between segments (Consumer/Information Products and Electronic Components).
· Operating income (loss) shown on pages 18-19 is the amount before elimination of intersegment trading.
· Total assets shown on pages 18-19 show the amounts before elimination of intersegment trading, and do not include corporate assets.
· Capital investment shown on pages 18-19 includes the amount of leased properties.
Audio-Visual and
Communication Equipment
Health and
Environmental Equipment
Information Equipment
2008
2007
2006
0 3,000
2010
2009
2,0001,000
2008
2007
2006
–50 150
2010
2009
100500
2008
2007
2006
0 2,000
2010
2009
1,5001,000500
2008
2007
2006
0 300
2010
2009
200100
Segment Outline
Sharp Corporation and Consolidated Subsidiaries
Years Ended March 31
Segment Outline
SHARP CORPORATION18