Sharp 2010 Annual Report Download - page 42
Download and view the complete annual report
Please find page 42 of the 2010 Sharp annual report below. You can navigate through the pages in the report by either clicking on the pages listed below, or by using the keyword search tool below to find specific information within the annual report.-
 1
1 -
2
-
3
-
4
-
5
-
6
-
7
-
8
-
9
-
10
-
11
-
12
-
13
-
14
-
15
-
16
-
17
-
18
-
19
-
20
-
21
-
22
-
23
-
24
-
25
-
26
-
27
-
28
-
29
-
30
-
31
-
 32
32 -
 33
33 -
 34
34 -
 35
35 -
 36
36 -
 37
37 -
 38
38 -
 39
39 -
 40
40 -
 41
41 -
 42
42 -
 43
43 -
 44
44 -
 45
45 -
 46
46 -
 47
47 -
 48
48 -
 49
49 -
 50
50 -
 51
51 -
 52
52 -
53
-
54
-
55
-
56
-
57
-
58
-
59
-
60
-
61
-
62
-
63
-
64
-
65
-
66
-
67
-
68
 |
 |

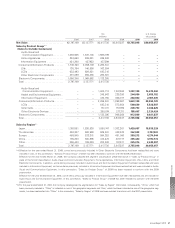
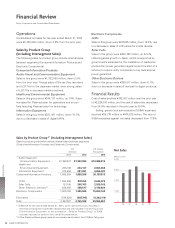
In Other, sales increased by 1.4% to ¥320,084 million
and operating income amounted to ¥7,908 million com-
pared to operating income of ¥5,158 million in the prior
year. Although sales of facsimiles declined, sales of
Blu-ray Disc recorders increased.
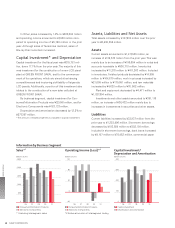
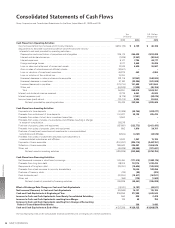
Capital Investment* and Depreciation
Capital investment for the fiscal year was ¥215,781 mil-
lion, down 17.1% from the prior year. The majority of this
was investment for the construction of a new LCD panel
plant at GREEN FRONT SAKAI, and for the commence-
ment of its operations, which are aimed at enhancing
competitiveness and improving profitability of large-size
LCD panels. Additionally, a portion of this investment also
relates to the construction of a new solar cell plant at
GREEN FRONT SAKAI.
By business segment, capital investment for Con-
sumer/Information Products was ¥32,648 million, and for
Electronic Components was ¥183,133 million.
Depreciation and amortization decreased by 12.2% to
¥277,257 million.
*The amount of leased properties is included in capital investment.
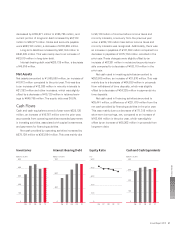
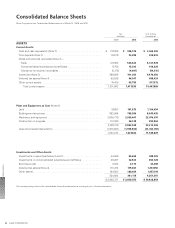
Assets, Liabilities and Net Assets
Total assets increased by ¥147,534 million over the prior
year to ¥2,836,255 million.
Assets
Current assets amounted to ¥1,417,535 million, an
increase of ¥115,573 million from the prior year. This was
mainly due to an increase of ¥106,654 million in notes and
accounts receivable to ¥536,718 million. Inventories
increased by ¥11,278 million to ¥411,263 million. Included
in inventories, finished products decreased by ¥14,959
million to ¥164,670 million, work in process increased by
¥21,609 million to ¥170,091 million, and raw materials
increased by ¥4,628 million to ¥76, 502 million.
Plant and equipment decreased by ¥4,471 million to
¥1,027,604 million.
Investments and other assets amounted to ¥391,116
million, an increase of ¥36,432 million mainly due to
increases in investments in securities and other assets.
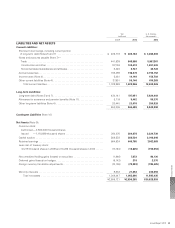
Liabilities
Current liabilities increased by ¥33,937 million from the
prior year to ¥1,223,906 million. Short-term borrowings
decreased by ¥103,589 million to ¥302,184 million.
Included in short-term borrowings, bank loans increased
by ¥9,107 million to ¥70,452 million, commercial paper
Capital Investment/
Depreciation and Amortization
(billions of yen)
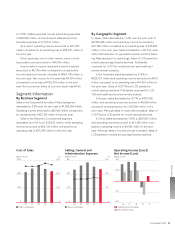
Sales*1
(billions of yen)
Operating Income (Loss)*2
(billions of yen)
nn Consumer/Information Products
nn Electronic Components
nn Consumer/Information Products
nn Electronic Components
nn Capital investment
nn Depreciation and amortization
*1 Including intersegment sales *2 Before elimination of intersegment trading
Information by Business Segment
400
0
08 09 100706
300
200
100
120
–40
08 09 100706
80
40
0
2,500
0
08 09 100706
2,000
1,500
1,000
500
Financial Section
SHARP CORPORATION40