Sharp 2010 Annual Report Download - page 38
Download and view the complete annual report
Please find page 38 of the 2010 Sharp annual report below. You can navigate through the pages in the report by either clicking on the pages listed below, or by using the keyword search tool below to find specific information within the annual report.-
 1
1 -
2
-
3
-
4
-
5
-
6
-
7
-
8
-
9
-
10
-
11
-
12
-
13
-
14
-
15
-
16
-
17
-
18
-
19
-
20
-
21
-
22
-
23
-
24
-
25
-
26
-
27
-
 28
28 -
 29
29 -
 30
30 -
 31
31 -
 32
32 -
 33
33 -
 34
34 -
 35
35 -
 36
36 -
 37
37 -
 38
38 -
 39
39 -
 40
40 -
 41
41 -
 42
42 -
 43
43 -
 44
44 -
 45
45 -
 46
46 -
 47
47 -
 48
48 -
49
-
50
-
51
-
52
-
53
-
54
-
55
-
56
-
57
-
58
-
59
-
60
-
61
-
62
-
63
-
64
-
65
-
66
-
67
-
68
 |
 |

Ye n
(millions)
U.S. Dollars
(thousands)
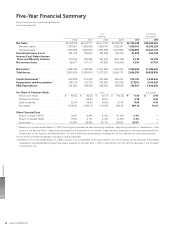
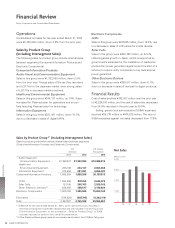
2006 2007 2008 2009 2010 2010
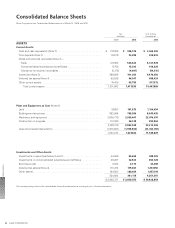
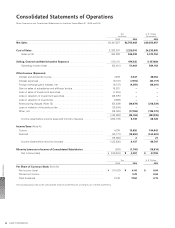
Net Sales . . . . . . . . . . . . . . . . . . . . . . . . . ¥2,797,109 ¥3,127,771 ¥3,417,736 ¥2,847,227 ¥2,755,948 $29,955,957
Domestic sales . . . . . . . . . . . . . . . . . . . 1,397,081 1,526,938 1,590,747 1,302,261 1,429,057 15,533,228
Overseas sales . . . . . . . . . . . . . . . . . . . 1,400,028 1,600,833 1,826,989 1,544,966 1,326,891 14,422,729
Operating Income (Loss) . . . . . . . . . . . . 163,710 186,531 183,692 (55,481) 51,903 564,163
Income (Loss) Before Income
Taxes and Minority Interests . . . . . . . . 140,018 158,295 162,240 (204,139) 6,139 66,728
Net Income (Loss). . . . . . . . . . . . . . . . . . 88,671 101,717 101,922 (125,815) 4,397 47,793
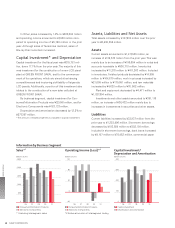
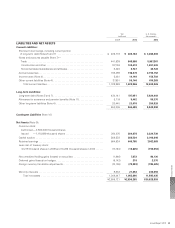
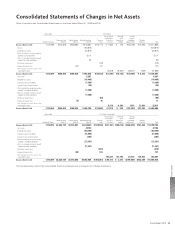
Net Assets*1 . . . . . . . . . . . . . . . . . . . . . . 1,098,910 1,192,205 1,241,868 1,048,447 1,065,860 11,585,435
Total Assets . . . . . . . . . . . . . . . . . . . . . . . 2,560,299 2,968,810 3,073,207 2,688,721 2,836,255 30,828,859
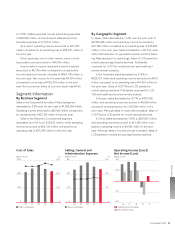
Capital Investment*2 . . . . . . . . . . . . . . . 238,839 314,301 344,262 260,337 215,781 2,345,446
Depreciation and Amortization*3 . . . . . 193,114 217,715 276,567 315,799 277,257 3,013,663
R&D Expenditures . . . . . . . . . . . . . . . . . 154,362 189,852 196,186 195,525 166,507 1,809,859
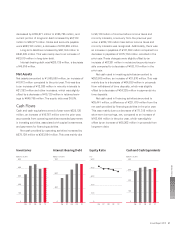
Per Share of Common Stock Ye n U.S. Dollars
Net income (loss) . . . . . . . . . . . . . . . . . ¥ 80.85 ¥ 93.25 ¥ 93.17 ¥ (114.33) ¥ 4.00 $ 0.04
Diluted net income . . . . . . . . . . . . . . . . – 90.00 86.91 – 3.78 0.04
Cash dividends . . . . . . . . . . . . . . . . . . . 22.00 26.00 28.00 21.00 1 7. 0 0 0.18
Net assets. . . . . . . . . . . . . . . . . . . . . . . 1,006.91 1,084.76 1,119.09 944.24 949.19 10.32
Other Financial Data
Return on equity (ROE) . . . . . . . . . . . . . 8.4% 8.9% 8.4% (11.1%) 0.4% –
Return on assets (ROA). . . . . . . . . . . . . 3.6% 3.7% 3.4% (4.4%) 0.2% –
Equity ratio . . . . . . . . . . . . . . . . . . . . . . 42.9% 39.9% 40.1% 38.6% 36.8% –
*1 Effective for the year ended March 31, 2007, the Company adopted the new accounting standards, “Accounting Standard for Presentation of Net
Assets in the Balance Sheet” (Accounting Standards Board Statement No. 5) and the “Implementation Guidance for the Accounting Standard for
Presentation of Net Assets in the Balance Sheet” (Financial Standards Implementation Guidance No. 8). Prior year figure has not been restated.
*2 The amount of leased properties is included in capital investment.
*3 Effective for the year ended March 31, 2008, pursuant to an amendment to the Corporate Tax Law, the Company and its domestic consolidated
subsidiaries have depreciated tangible fixed assets acquired on and after April 1, 2007 in accordance with the method stipulated in the amended
Corporate Tax Law.
Five-Year Financial Summary
Sharp Corporation and Consolidated Subsidiaries
Years Ended March 31
Financial Section
SHARP CORPORATION36