Sharp 2009 Annual Report Download - page 63
Download and view the complete annual report
Please find page 63 of the 2009 Sharp annual report below. You can navigate through the pages in the report by either clicking on the pages listed below, or by using the keyword search tool below to find specific information within the annual report.-
 1
1 -
2
-
3
-
4
-
5
-
6
-
7
-
8
-
9
-
10
-
11
-
12
-
13
-
14
-
15
-
16
-
17
-
18
-
19
-
20
-
21
-
22
-
23
-
24
-
25
-
26
-
27
-
28
-
29
-
30
-
31
-
32
-
33
-
34
-
35
-
36
-
37
-
38
-
39
-
40
-
41
-
42
-
43
-
44
-
45
-
46
-
47
-
48
-
49
-
50
-
51
-
52
-
 53
53 -
 54
54 -
 55
55 -
 56
56 -
 57
57 -
 58
58 -
 59
59 -
 60
60 -
 61
61 -
 62
62 -
 63
63 -
 64
64 -
 65
65 -
 66
66 -
 67
67 -
 68
68
 |
 |

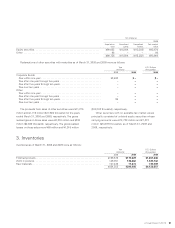
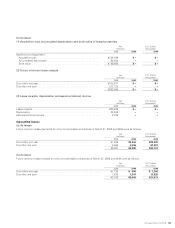
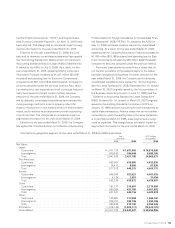
Overseas sales for the years ended March 31, 2008 and 2009 were as follows:
Yen
(millions)
U.S. Dollars
(thousands)
2008 2009 2009
Overseas sales:
The Americas . . . . . . . . . . . . . . . . . . . . . . . . . . . . . . . . . . . . . . . . . . . . . . . . . ¥ 625,841 ¥ 488,428 $ 5,035,340
Europe. . . . . . . . . . . . . . . . . . . . . . . . . . . . . . . . . . . . . . . . . . . . . . . . . . . . . . . 584,252 451,090 4,650,413
China. . . . . . . . . . . . . . . . . . . . . . . . . . . . . . . . . . . . . . . . . . . . . . . . . . . . . . . . 412,470 407,777 4,203,887
Other. . . . . . . . . . . . . . . . . . . . . . . . . . . . . . . . . . . . . . . . . . . . . . . . . . . . . . . . 204,426 197,671 2,037,845
Total . . . . . . . . . . . . . . . . . . . . . . . . . . . . . . . . . . . . . . . . . . . . . . . . . . . . . . . . ¥1,826,989 ¥1,544,966 $15,927,485
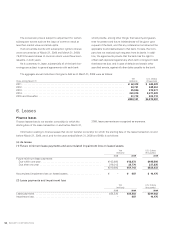
(ASBJ Guidance No. 16, revised on March 30, 2007 (originally
issued by the Auditing Standards Committee of JICPA on
January 18, 1994)) and are accounting for such transactions as
capital lease transactions. Finance leases that do not transfer
ownership for which the starting date of the lease transaction
is on and before to March 31, 2008, lease payments are rec-
ognized as expenses. This change has an immaterial impact
on segmented information for the year ended March 31, 2009.
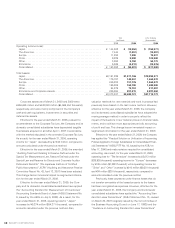
Overseas sales were comprised of overseas consolidated
subsidiaries’ sales and the Company’s and its domestic con-
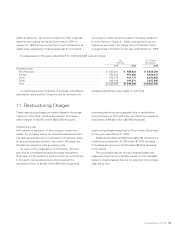
11. Restructuring Charges
solidated subsidiaries’ export sales to customers.
These restructuring charges are mainly related to the reorga-
nization of LCD plants, including depreciation and mainte-
nance charges of ¥43,051 million ($443,825 thousand)
concerning plants that are suspended due to centralization
and optimization of LCD production and impairment losses of
fixed assets of ¥9,468 million ($97,608 thousand).
(Impairment Loss)
With regards to application of accounting for impairment
assets, the Company and its consolidated subsidiaries identi-
fies cash generating units in consideration of business charac-
teristics and business operation. As a result, idle assets are
identified as respective cash generating units.
As a part of the reorganization of LCD plants, the Com-
pany and its consolidated subsidiaries mainly reduced the
book value of LCD production facilities which are expected not
to be used to recoverable amount, and recognized the
decreased amount of ¥9,468 million ($97,608 thousand) as
restructuring charges categorized in Other Income (Expenses)
for the year ended March 31, 2009.
Details are as follows: ¥4,926 million ($50,784 thousand), for
machinery and equipment; ¥1,262 million ($13,010 thousand),
for buildings and structures; ¥3,280 million ($33,814 thousand),
for the others.
The recoverable amount of those impaired assets was
measured using their net realizable values, and net realizable
values of impaired assets that are not expected to be sold are
regarded as zero.