Sharp 2009 Annual Report Download - page 48
Download and view the complete annual report
Please find page 48 of the 2009 Sharp annual report below. You can navigate through the pages in the report by either clicking on the pages listed below, or by using the keyword search tool below to find specific information within the annual report.-
 1
1 -
2
-
3
-
4
-
5
-
6
-
7
-
8
-
9
-
10
-
11
-
12
-
13
-
14
-
15
-
16
-
17
-
18
-
19
-
20
-
21
-
22
-
23
-
24
-
25
-
26
-
27
-
28
-
29
-
30
-
31
-
32
-
33
-
34
-
35
-
36
-
37
-
 38
38 -
 39
39 -
 40
40 -
 41
41 -
 42
42 -
 43
43 -
 44
44 -
 45
45 -
 46
46 -
 47
47 -
 48
48 -
 49
49 -
 50
50 -
 51
51 -
 52
52 -
 53
53 -
 54
54 -
 55
55 -
 56
56 -
 57
57 -
 58
58 -
59
-
60
-
61
-
62
-
63
-
64
-
65
-
66
-
67
-
68
 |
 |

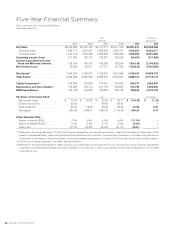
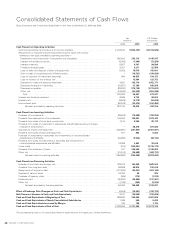
Sharp Corporation and Consolidated Subsidiaries for the Years Ended March 31, 2008 and 2009
Yen
(millions)
U.S. Dollars
(thousands)
2008 2009 2009
Cash Flows from Operating Activities:
Income (loss) before income taxes and minority interests . . . . . . . . . . . . . . . . . . . . . . . . . . . . . . . ¥ 162,240 ¥(204,139) $(2,104,526)
Adjustments to reconcile income (loss) before income taxes and minority
interests to net cash provided by operating activities—
Depreciation and amortization of properties and intangibles . . . . . . . . . . . . . . . . . . . . . . . . . . . 265,640 305,115 3,145,515
Interest and dividends income . . . . . . . . . . . . . . . . . . . . . . . . . . . . . . . . . . . . . . . . . . . . . . . . . . (8,086) (7,009) (72,258)
Interest expenses . . . . . . . . . . . . . . . . . . . . . . . . . . . . . . . . . . . . . . . . . . . . . . . . . . . . . . . . . . . . 9,957 9,147 94,299
Foreign exchange losses. . . . . . . . . . . . . . . . . . . . . . . . . . . . . . . . . . . . . . . . . . . . . . . . . . . . . . . 3,067 2,217 22,856
Loss on sales and disposal of plant and equipment . . . . . . . . . . . . . . . . . . . . . . . . . . . . . . . . . . 8,039 10,576 109,031
Gain on sales of subsidiaries and affiliate’s stocks . . . . . . . . . . . . . . . . . . . . . . . . . . . . . . . . . . . – (18,521) (190,938)
Loss on valuation of investment securities . . . . . . . . . . . . . . . . . . . . . . . . . . . . . . . . . . . . . . . . . 694 49,875 514,175
Loss on violation of the antitrust law . . . . . . . . . . . . . . . . . . . . . . . . . . . . . . . . . . . . . . . . . . . . . – 12,004 123,753
Decrease in notes and accounts receivable . . . . . . . . . . . . . . . . . . . . . . . . . . . . . . . . . . . . . . . . 3,931 102,119 1,052,773
Decrease (increase) in inventories . . . . . . . . . . . . . . . . . . . . . . . . . . . . . . . . . . . . . . . . . . . . . . . (24,557) 27,180 280,206
Decrease in payables . . . . . . . . . . . . . . . . . . . . . . . . . . . . . . . . . . . . . . . . . . . . . . . . . . . . . . . . . (28,200) (175,734) (1,811,691)
Other, net . . . . . . . . . . . . . . . . . . . . . . . . . . . . . . . . . . . . . . . . . . . . . . . . . . . . . . . . . . . . . . . . . . (15,803) (53,539) (551,948)
Total . . . . . . . . . . . . . . . . . . . . . . . . . . . . . . . . . . . . . . . . . . . . . . . . . . . . . . . . . . . . . . . . . . . . . 376,922 59,291 611,247
Interest and dividends received . . . . . . . . . . . . . . . . . . . . . . . . . . . . . . . . . . . . . . . . . . . . . . . . . . . 8,939 8,735 90,052
Interest paid . . . . . . . . . . . . . . . . . . . . . . . . . . . . . . . . . . . . . . . . . . . . . . . . . . . . . . . . . . . . . . . . . . (9,849) (9,179) (94,629)
Income taxes paid. . . . . . . . . . . . . . . . . . . . . . . . . . . . . . . . . . . . . . . . . . . . . . . . . . . . . . . . . . . . . . (52,248) (33,412) (344,454)
Net cash provided by operating activities . . . . . . . . . . . . . . . . . . . . . . . . . . . . . . . . . . . . . . 323,764 25,435 262,216
Cash Flows from Investing Activities:
Purchase of time deposits . . . . . . . . . . . . . . . . . . . . . . . . . . . . . . . . . . . . . . . . . . . . . . . . . . . . . . . (99,502) (74,089) (763,804)
Proceeds from redemption of time deposits . . . . . . . . . . . . . . . . . . . . . . . . . . . . . . . . . . . . . . . . . 105,364 104,027 1,072,443
Proceeds from sales of short-term investments . . . . . . . . . . . . . . . . . . . . . . . . . . . . . . . . . . . . . . 7,514 2,500 25,773
Proceeds from sales of investment in subsidiaries and affiliates resulting in change
of scope of consolidation . . . . . . . . . . . . . . . . . . . . . . . . . . . . . . . . . . . . . . . . . . . . . . . . . . . . . . . – 28,278 291,526
Acquisitions of plant and equipment. . . . . . . . . . . . . . . . . . . . . . . . . . . . . . . . . . . . . . . . . . . . . . . . (362,927) (237,801) (2,451,557)
Proceeds from sales of plant and equipment . . . . . . . . . . . . . . . . . . . . . . . . . . . . . . . . . . . . . . . . . 871 893 9,206
Purchase of investments in securities and investments in nonconsolidated
subsidiaries and affiliates . . . . . . . . . . . . . . . . . . . . . . . . . . . . . . . . . . . . . . . . . . . . . . . . . . . . . . . (54,994) (5,504) (56,742)
Proceeds from sales of investments in securities and investments in
nonconsolidated subsidiaries and affiliates . . . . . . . . . . . . . . . . . . . . . . . . . . . . . . . . . . . . . . . . . . 19,385 3,843 39,619
Loans made . . . . . . . . . . . . . . . . . . . . . . . . . . . . . . . . . . . . . . . . . . . . . . . . . . . . . . . . . . . . . . . . . . (510) (304,267) (3,136,773)
Proceeds from collection of loans. . . . . . . . . . . . . . . . . . . . . . . . . . . . . . . . . . . . . . . . . . . . . . . . . . 347 306,520 3,160,000
Other, net . . . . . . . . . . . . . . . . . . . . . . . . . . . . . . . . . . . . . . . . . . . . . . . . . . . . . . . . . . . . . . . . . . . . (10,510) (46,629) (480,711)
Net cash used in investing activities . . . . . . . . . . . . . . . . . . . . . . . . . . . . . . . . . . . . . . . . . . (394,962) (222,229) (2,291,020)
Cash Flows from Financing Activities:
Increase in short-term borrowings, net. . . . . . . . . . . . . . . . . . . . . . . . . . . . . . . . . . . . . . . . . . . . . . 128,472 163,494 1,685,505
Proceeds from long-term debt . . . . . . . . . . . . . . . . . . . . . . . . . . . . . . . . . . . . . . . . . . . . . . . . . . . . 89,898 88,912 916,618
Repayments of long-term debt. . . . . . . . . . . . . . . . . . . . . . . . . . . . . . . . . . . . . . . . . . . . . . . . . . . . (121,994) (35,031) (361,144)
Disposal of treasury stock. . . . . . . . . . . . . . . . . . . . . . . . . . . . . . . . . . . . . . . . . . . . . . . . . . . . . . . . 19,786 80 825
Purchase of treasury stock . . . . . . . . . . . . . . . . . . . . . . . . . . . . . . . . . . . . . . . . . . . . . . . . . . . . . . . (369) (176) (1,814)
Dividends paid. . . . . . . . . . . . . . . . . . . . . . . . . . . . . . . . . . . . . . . . . . . . . . . . . . . . . . . . . . . . . . . . . (30,530) (30,804) (317,567)
Other, net . . . . . . . . . . . . . . . . . . . . . . . . . . . . . . . . . . . . . . . . . . . . . . . . . . . . . . . . . . . . . . . . . . . . (1,169) (246) (2,536)
Net cash provided by financing activities . . . . . . . . . . . . . . . . . . . . . . . . . . . . . . . . . . . . . . . 84,094 186,229 1,919,887
Effect of Exchange Rate Changes on Cash and Cash Equivalents. . . . . . . . . . . . . . . . . . . . . . . . (4,549) (12,001) (123,722)
Net (Decrease) Increase in Cash and Cash Equivalents . . . . . . . . . . . . . . . . . . . . . . . . . . . . . . . . 8,347 (22,566) (232,639)
Cash and Cash Equivalents at Beginning of Year . . . . . . . . . . . . . . . . . . . . . . . . . . . . . . . . . . . . . 329,286 339,266 3,497,588
Cash and Cash Equivalents of Newly Consolidated Subsidiaries . . . . . . . . . . . . . . . . . . . . . . . . 1,439 550 5,670
Cash and Cash Equivalents Increased by Merger . . . . . . . . . . . . . . . . . . . . . . . . . . . . . . . . . . . . . 194 108 1,113
Cash and Cash Equivalents at End of Year. . . . . . . . . . . . . . . . . . . . . . . . . . . . . . . . . . . . . . . . . . . ¥ 339,266 ¥ 317,358 $ 3,271,732
The accompanying notes to the consolidated financial statements are an integral part of these statements.