Sharp 2009 Annual Report Download - page 5
Download and view the complete annual report
Please find page 5 of the 2009 Sharp annual report below. You can navigate through the pages in the report by either clicking on the pages listed below, or by using the keyword search tool below to find specific information within the annual report.-
 1
1 -
 2
2 -
 3
3 -
 4
4 -
 5
5 -
 6
6 -
 7
7 -
 8
8 -
 9
9 -
 10
10 -
 11
11 -
 12
12 -
 13
13 -
 14
14 -
 15
15 -
 16
16 -
17
-
18
-
19
-
20
-
21
-
22
-
23
-
24
-
25
-
26
-
27
-
28
-
29
-
30
-
31
-
32
-
33
-
34
-
35
-
36
-
37
-
38
-
39
-
40
-
41
-
42
-
43
-
44
-
45
-
46
-
47
-
48
-
49
-
50
-
51
-
52
-
53
-
54
-
55
-
56
-
57
-
58
-
59
-
60
-
61
-
62
-
63
-
64
-
65
-
66
-
67
-
68
 |
 |

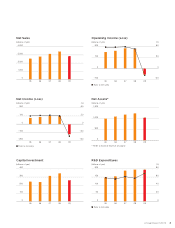
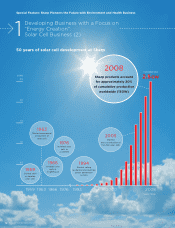
4,000
07
3,000
2,000
1,000
0
08 090605
200
–6.0
07
6.0
100 3.0
0 0
–100 –3.0
–200
08 090605
400
07
300
200
100
0
08 090605
200
–3.0
07
6.0
100 3.0
–100
00
08 090605
1,500
1,000
500
07
0
08 090605
200
0
07
8.0
150 6.0
100 4.0
50 2.0
0
08 090605
Net Sales
(billions of yen)
Net Income (Loss)
(billions of yen) (%)
Capital Investment
(billions of yen)
Operating Income (Loss)
(billions of yen) (%)
Net Assets*
(billions of yen)
R&D Expenditures
(billions of yen) (%)
n Ratio to net sales
n Ratio to net sales
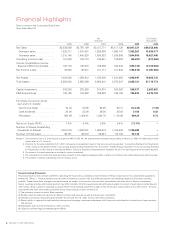
* Refer to footnote (Note 2) on page 2
n Ratio to net sales