Sharp 2009 Annual Report Download - page 38
Download and view the complete annual report
Please find page 38 of the 2009 Sharp annual report below. You can navigate through the pages in the report by either clicking on the pages listed below, or by using the keyword search tool below to find specific information within the annual report.-
 1
1 -
2
-
3
-
4
-
5
-
6
-
7
-
8
-
9
-
10
-
11
-
12
-
13
-
14
-
15
-
16
-
17
-
18
-
19
-
20
-
21
-
22
-
23
-
24
-
25
-
26
-
27
-
 28
28 -
 29
29 -
 30
30 -
 31
31 -
 32
32 -
 33
33 -
 34
34 -
 35
35 -
 36
36 -
 37
37 -
 38
38 -
 39
39 -
 40
40 -
 41
41 -
 42
42 -
 43
43 -
 44
44 -
 45
45 -
 46
46 -
 47
47 -
 48
48 -
49
-
50
-
51
-
52
-
53
-
54
-
55
-
56
-
57
-
58
-
59
-
60
-
61
-
62
-
63
-
64
-
65
-
66
-
67
-
68
 |
 |

Yen
(millions)
U.S. Dollars
(thousands)
2005 2006 2007 2008 2009 2009
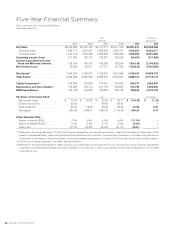
Net Sales . . . . . . . . . . . . . . . . . . . . . . . . . ¥2,539,859 ¥2,797,109 ¥3,127,771 ¥3,417,736 ¥2,847,227 $29,352,856
Domestic sales . . . . . . . . . . . . . . . . . . . 1,329,711 1,397,081 1,526,938 1,590,747 1,302,261 13,425,371
Overseas sales . . . . . . . . . . . . . . . . . . . 1,210,148 1,400,028 1,600,833 1,826,989 1,544,966 15,927,485
Operating Income (Loss) . . . . . . . . . . . . 151,020 163,710 186,531 183,692 (55,481) (571,969)
Income (Loss) Before Income
Taxes and Minority Interests . . . . . . . . 128,184 140,018 158,295 162,240 (204,139) (2,104,526)
Net Income (Loss). . . . . . . . . . . . . . . . . . 76,845 88,671 101,717 101,922 (125,815) (1,297,062)
Net Assets*1 . . . . . . . . . . . . . . . . . . . . . . 1,004,326 1,098,910 1,192,205 1,241,868 1,048,447 10,808,732
Total Assets. . . . . . . . . . . . . . . . . . . . . . . 2,385,026 2,560,299 2,968,810 3,073,207 2,688,721 27,718,773
Capital Investment*2 . . . . . . . . . . . . . . . 243,388 238,839 314,301 344,262 260,337 2,683,887
Depreciation and Amortization*3 . . . . . 175,969 193,114 217,715 276,567 315,799 3,255,660
R&D Expenditures . . . . . . . . . . . . . . . . . 148,128 154,362 189,852 196,186 195,525 2,015,722
Per Share of Common Stock Yen U.S. Dollars
Net income (loss) . . . . . . . . . . . . . . . . . ¥ 70.04 ¥ 80.85 ¥ 93.25 ¥ 93.17 ¥ (114.33) $ (1.18)
Diluted net income . . . . . . . . . . . . . . . . 69.60 – 90.00 86.91 – –
Cash dividends . . . . . . . . . . . . . . . . . . . 20.00 22.00 26.00 28.00 21.00 0.22
Net assets. . . . . . . . . . . . . . . . . . . . . . . 920.09 1,006.91 1,084.76 1,119.09 944.24 9.73
Other Financial Data
Return on equity (ROE) . . . . . . . . . . . . . 7.9% 8.4% 8.9% 8.4% (11.1%) –
Return on assets (ROA) . . . . . . . . . . . . 3.4% 3.6% 3.7% 3.4% (4.4%) –
Equity ratio . . . . . . . . . . . . . . . . . . . . . . 42.1% 42.9% 39.9% 40.1% 38.6% –
*1 Effective for the year ended March 31, 2007, the Company adopted the new accounting standards, “Accounting Standard for Presentation of Net
Assets in the Balance Sheet” (Accounting Standards Board Statement No. 5) and the “Implementation Guidance for the Accounting Standard for
Presentation of Net Assets in the Balance Sheet” (Financial Standards Implementation Guidance No. 8). Prior year figures have not been restated.
*2 The amount of leased properties is included in capital investment.
*3 Effective for the year ended March 31, 2008, pursuant to an amendment to the Corporate Tax Law, the Company and its domestic consolidated
subsidiaries have depreciated tangible fixed assets acquired on and after April 1, 2007 in accordance with the method stipulated in the amended
Corporate Tax Law.
Sharp Corporation and Consolidated Subsidiaries
Years Ended March 31