Sharp 2009 Annual Report Download - page 4
Download and view the complete annual report
Please find page 4 of the 2009 Sharp annual report below. You can navigate through the pages in the report by either clicking on the pages listed below, or by using the keyword search tool below to find specific information within the annual report.-
 1
1 -
 2
2 -
 3
3 -
 4
4 -
 5
5 -
 6
6 -
 7
7 -
 8
8 -
 9
9 -
 10
10 -
 11
11 -
 12
12 -
 13
13 -
 14
14 -
 15
15 -
16
-
17
-
18
-
19
-
20
-
21
-
22
-
23
-
24
-
25
-
26
-
27
-
28
-
29
-
30
-
31
-
32
-
33
-
34
-
35
-
36
-
37
-
38
-
39
-
40
-
41
-
42
-
43
-
44
-
45
-
46
-
47
-
48
-
49
-
50
-
51
-
52
-
53
-
54
-
55
-
56
-
57
-
58
-
59
-
60
-
61
-
62
-
63
-
64
-
65
-
66
-
67
-
68
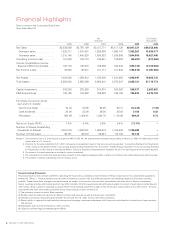
 |
 |

Yen
(millions)
U.S. Dollars
(thousands)
2005 2006 2007 2008 2009 2009
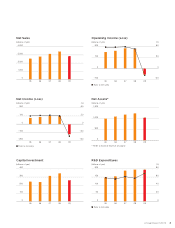
Net Sales .................... ¥2,539,859 ¥2,797,109 ¥3,127,771 ¥3,417,736 ¥2,847,227 $29,352,856
Domestic sales .............. 1,329,711 1,397,081 1,526,938 1,590,747 1,302,261 13,425,371
Overseas sales .............. 1,210,148 1,400,028 1,600,833 1,826,989 1,544,966 15,927,485
Operating Income (Loss) ........ 151,020 163,710 186,531 183,692 (55,481) (571,969)
Income (Loss) Before Income
Taxes and Minority Interests.....
128,184
140,018
158,295
162,240
(204,139)
(2,104,526)
Net Income (Loss) ............. 76,845 88,671 101,717 101,922 (125,815) (1,297,062)
Net Assets ................... 1,004,326 1,098,910 1,192,205 1,241,868 1,048,447 10,808,732
Total Assets .................. 2,385,026 2,560,299 2,968,810 3,073,207 2,688,721 27,718,773
Capital Investment ............. 243,388 238,839 314,301 344,262 260,337 2,683,887
R&D Expenditures ............. 148,128 154,362 189,852 196,186 195,525 2,015,722
Per Share of Common Stock
(yen and U.S. dollars)
Net income (loss) ............ 70.04 80.85 93.25 93.17 (114.33) (1.18)
Cash dividends .............. 20.00 22.00 26.00 28.00 21.00 0.22
Net assets.................. 920.09 1,006.91 1,084.76 1,119.09 944.24 9.73
Return on Equity (ROE) ......... 7.9% 8.4% 8.9% 8.4% (11.1%) –
Number of Shares Outstanding
(thousands of shares) ..........
1,091,075
1,090,901
1,090,678
1,100,525 1,100,480
–
Number of Employees .......... 46,751 46,872 48,927 53,708 54,144 –
(Notes) 1. The translation into U.S. dollar figures is based on ¥97=U.S.$1.00, the approximate exchange rate prevailing on March 31, 2009. All dollar figures here-
inafter refer to U.S. currency.
2. Effective for the year ended March 31, 2007, net assets are presented based on the new accounting standard, “Accounting Standard for Presentation
of Net Assets in the Balance Sheet” (Accounting Standards Board Statement No. 5) and the “Implementation Guidance for the Accounting Standard
for Presentation of Net Assets in the Balance Sheet” (Financial Standards Implementation Guidance No. 8). Prior year figures have not been restated.
3. The amount of leased properties is included in capital investment.
4. The computation of net income (loss) per share is based on the weighted average number of shares of common stock outstanding during each fiscal year.
5. The number of shares outstanding is net of treasury stock.
Forward-Looking Statements
This annual report contains certain statements describing the future plans, strategies and performance of Sharp Corporation and its consolidated subsidiaries
(hereinafter “Sharp”). These statements are not based on historical or present fact, but rather assumptions and estimates based on information currently
available. These future plans, strategies and performance are subject to known and unknown risks, uncertainties and other factors. Sharp’s actual perfor-
mance, business activities and financial position may differ materially from the assumptions and estimates provided on account of such risks, uncertainties and
other factors. Sharp is under no obligation to update these forward-looking statements in light of new information, future events or any other factors. The risks,
uncertainties and other factors that could affect actual results include, but are not limited to:
(1) The economic situation in which Sharp operates
(2) Sudden, rapid fluctuations in demand for Sharp’s products and services, as well as intense price competition
(3) Changes in exchange rates (particularly between the yen and the U.S. dollar, the euro and other currencies)
(4) Sharp’s ability to respond to rapid technical changes and changing consumer preferences with timely and cost-effective introductions of new products
and services
(5) Regulations such as trade restrictions in other countries
(6) Litigation and other legal proceedings against Sharp
Sharp Corporation and Consolidated Subsidiaries
Years Ended March 31