Sharp 2009 Annual Report Download - page 43
Download and view the complete annual report
Please find page 43 of the 2009 Sharp annual report below. You can navigate through the pages in the report by either clicking on the pages listed below, or by using the keyword search tool below to find specific information within the annual report.-
 1
1 -
2
-
3
-
4
-
5
-
6
-
7
-
8
-
9
-
10
-
11
-
12
-
13
-
14
-
15
-
16
-
17
-
18
-
19
-
20
-
21
-
22
-
23
-
24
-
25
-
26
-
27
-
28
-
29
-
30
-
31
-
32
-
 33
33 -
 34
34 -
 35
35 -
 36
36 -
 37
37 -
 38
38 -
 39
39 -
 40
40 -
 41
41 -
 42
42 -
 43
43 -
 44
44 -
 45
45 -
 46
46 -
 47
47 -
 48
48 -
 49
49 -
 50
50 -
 51
51 -
 52
52 -
 53
53 -
54
-
55
-
56
-
57
-
58
-
59
-
60
-
61
-
62
-
63
-
64
-
65
-
66
-
67
-
68
 |
 |

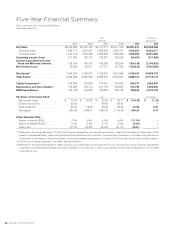
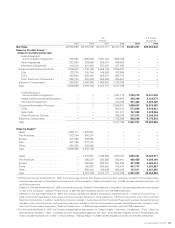
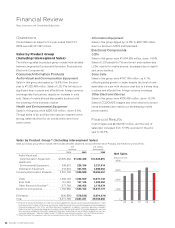
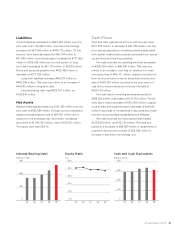
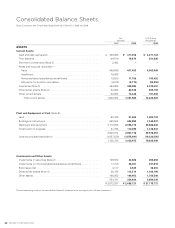
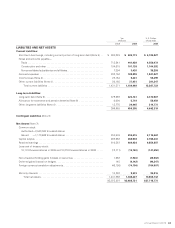
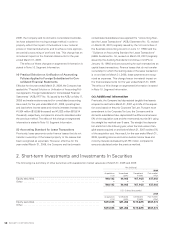
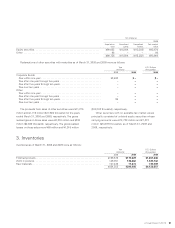
Current liabilities decreased by ¥241,402 million over the
prior year to ¥1,189,969 million. Short-term borrowings
increased by ¥81,445 million to ¥405,773 million. Of this
amount, bank loans decreased by ¥58,794 million to
¥61,345 million, commercial paper increased by ¥177,258
million to ¥335,426 million and current portion of long-
term debt decreased by ¥37,172 million to ¥8,839 million.
Notes and accounts payable were ¥552,485 million, a
decrease of ¥273,025 million.
Long-term liabilities increased ¥50,337 million to
¥450,305 million. This was due mainly to an increase of
¥44,548 million in long-term debt.
Interest-bearing debt was ¥829,751 million, up
¥125,840 million.
Retained earnings decreased by ¥151,463 million over the
prior year to ¥664,924 million. Foreign currency translation
adjustments generated a loss of ¥28,041 million due to
variation in the exchange rate. As a result, net assets
amounted to ¥1,048,447 million, down ¥193,421 million.
The equity ratio was 38.6 %.
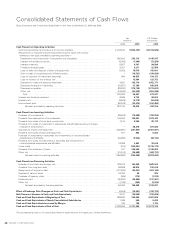
Cash and cash equivalents at the end of the year were
¥317,358 million, a decrease of ¥21,908 million over the
prior year as payments in investing activities associated
with capital investments exceeded proceeds from operat-
ing activities and financing activities.
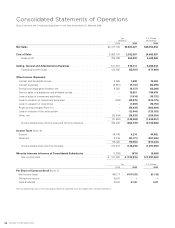
Net cash provided by operating activities decreased
by ¥298,329 million to ¥25,435 million. This was due
mainly to an increase in the loss on valuation of invest-
ment securities of ¥49,181 million, despite a turnaround
from an income before income taxes and minority inter-
ests of ¥162,240 million recorded in the prior year to a
loss before income taxes and minority interests of
¥204,139 million.
Net cash used in investing activities amounted to
¥222,229 million, a decrease of ¥172,733 million. The pri-
mary factor was a decrease of ¥125,126 million in acquisi-
tions of plant and equipment and a decrease of ¥49,490
million in purchase of investments in securities and invest-
ments in nonconsolidated subsidiaries and affiliates.
Net cash provided by financing activities totaled
¥186,229 million, up ¥102,135 million. This was due
mainly to a decrease of ¥86,963 million in repayments of
long-term debt and an increase of ¥35,022 million in
increase in short-term borrowings, net.
Interest-Bearing Debt
(billions of yen)
Equity Ratio
(%)
Cash and Cash Equivalents
(billions of yen)
900
600
300
07
0
08 090605
07 08 090605
50.0
40.0
30.0
20.0
10.0
0.0
400
300
200
100
07
0
08 090605