Sharp 2009 Annual Report Download - page 54
Download and view the complete annual report
Please find page 54 of the 2009 Sharp annual report below. You can navigate through the pages in the report by either clicking on the pages listed below, or by using the keyword search tool below to find specific information within the annual report.-
 1
1 -
2
-
3
-
4
-
5
-
6
-
7
-
8
-
9
-
10
-
11
-
12
-
13
-
14
-
15
-
16
-
17
-
18
-
19
-
20
-
21
-
22
-
23
-
24
-
25
-
26
-
27
-
28
-
29
-
30
-
31
-
32
-
33
-
34
-
35
-
36
-
37
-
38
-
39
-
40
-
41
-
42
-
43
-
 44
44 -
 45
45 -
 46
46 -
 47
47 -
 48
48 -
 49
49 -
 50
50 -
 51
51 -
 52
52 -
 53
53 -
 54
54 -
 55
55 -
 56
56 -
 57
57 -
 58
58 -
 59
59 -
 60
60 -
 61
61 -
 62
62 -
 63
63 -
 64
64 -
65
-
66
-
67
-
68
 |
 |

2008 and 2009.
The Company and its wholly owned domestic subsidiaries
have adopted the consolidated tax return system of Japan.
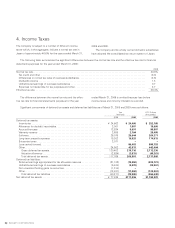
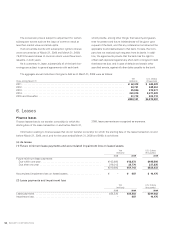
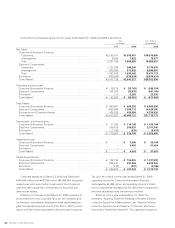
4. Income Taxes
The Company is subject to a number of different income
taxes which, in the aggregate, indicate a normal tax rate in
Japan of approximately 40.6% for the years ended March 31,
The following table summarizes the significant differences between the normal tax rate and the effective tax rate for financial
statements purposes for the year ended March 31, 2008:
2008
Normal tax rate. . . . . . . . . . . . . . . . . . . . . . . . . . . . . . . . . . . . . . . . . . . . . . . . . . . . . . . . . . . . . . . . . . . . . . . . . . . . . . . . . . . 40.6%
Tax credit and other . . . . . . . . . . . . . . . . . . . . . . . . . . . . . . . . . . . . . . . . . . . . . . . . . . . . . . . . . . . . . . . . . . . . . . . . . . . . . (6.0)
Differences in normal tax rates of overseas subsidiaries . . . . . . . . . . . . . . . . . . . . . . . . . . . . . . . . . . . . . . . . . . . . . . . . . (2.9)
Dividends income . . . . . . . . . . . . . . . . . . . . . . . . . . . . . . . . . . . . . . . . . . . . . . . . . . . . . . . . . . . . . . . . . . . . . . . . . . . . . . . 1.3
Undistributed earnings of overseas subsidiaries . . . . . . . . . . . . . . . . . . . . . . . . . . . . . . . . . . . . . . . . . . . . . . . . . . . . . . . 0.7
Expenses not deductible for tax purposes and other . . . . . . . . . . . . . . . . . . . . . . . . . . . . . . . . . . . . . . . . . . . . . . . . . . . . 2.7
Effective tax rate . . . . . . . . . . . . . . . . . . . . . . . . . . . . . . . . . . . . . . . . . . . . . . . . . . . . . . . . . . . . . . . . . . . . . . . . . . . . . . . . . 36.4%
The difference between the normal tax rate and the effec-
tive tax rate for financial statements purposes for the year
ended March 31, 2009 is omitted because loss before
income taxes and minority interests is recorded.
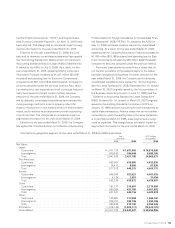
Significant components of deferred tax assets and deferred tax liabilities as of March 31, 2008 and 2009 were as follows:
Yen
(millions)
U.S. Dollars
(thousands)
2008 2009 2009
Deferred tax assets:
Inventories . . . . . . . . . . . . . . . . . . . . . . . . . . . . . . . . . . . . . . . . . . . . . . . . . . . ¥ 24,862 ¥ 24,460 $ 252,165
Allowance for doubtful receivables. . . . . . . . . . . . . . . . . . . . . . . . . . . . . . . . . 2,001 1,907 19,660
Accrued bonuses . . . . . . . . . . . . . . . . . . . . . . . . . . . . . . . . . . . . . . . . . . . . . . 12,534 9,691 99,907
Warranty reserve . . . . . . . . . . . . . . . . . . . . . . . . . . . . . . . . . . . . . . . . . . . . . . 2,655 2,764 28,495
Software . . . . . . . . . . . . . . . . . . . . . . . . . . . . . . . . . . . . . . . . . . . . . . . . . . . . . 26,075 25,644 264,371
Long-term prepaid expenses . . . . . . . . . . . . . . . . . . . . . . . . . . . . . . . . . . . . . 15,302 16,928 174,515
Enterprise taxes . . . . . . . . . . . . . . . . . . . . . . . . . . . . . . . . . . . . . . . . . . . . . . . 2,071 – –
Loss carried forward . . . . . . . . . . . . . . . . . . . . . . . . . . . . . . . . . . . . . . . . . . . . – 86,403 890,753
Other. . . . . . . . . . . . . . . . . . . . . . . . . . . . . . . . . . . . . . . . . . . . . . . . . . . . . . . . 34,903 42,919 442,464
Gross deferred tax assets . . . . . . . . . . . . . . . . . . . . . . . . . . . . . . . . . . . . . . 120,403 210,716 2,172,330
Valuation allowance . . . . . . . . . . . . . . . . . . . . . . . . . . . . . . . . . . . . . . . . . . . (2,634) (3,915) (40,361)
Total deferred tax assets . . . . . . . . . . . . . . . . . . . . . . . . . . . . . . . . . . . . . . . 117,769 206,801 2,131,969
Deferred tax liabilities:
Retained earnings appropriated for tax allowable reserves . . . . . . . . . . . . . . (21,132) (19,858) (204,721)
Undistributed earnings of overseas subsidiaries . . . . . . . . . . . . . . . . . . . . . . (5,424) (3,838) (39,567)
Net unrealized holding gains on securities . . . . . . . . . . . . . . . . . . . . . . . . . . . (1,314) – –
Other. . . . . . . . . . . . . . . . . . . . . . . . . . . . . . . . . . . . . . . . . . . . . . . . . . . . . . . . (12,401) (11,869) (122,361)
Total deferred tax liabilities . . . . . . . . . . . . . . . . . . . . . . . . . . . . . . . . . . . . . (40,271) (35,565) (366,649)
Net deferred tax assets . . . . . . . . . . . . . . . . . . . . . . . . . . . . . . . . . . . . . . . . . . . ¥ 77,498 ¥171,236 $1,765,320