Sharp 2009 Annual Report Download - page 46
Download and view the complete annual report
Please find page 46 of the 2009 Sharp annual report below. You can navigate through the pages in the report by either clicking on the pages listed below, or by using the keyword search tool below to find specific information within the annual report.-
 1
1 -
2
-
3
-
4
-
5
-
6
-
7
-
8
-
9
-
10
-
11
-
12
-
13
-
14
-
15
-
16
-
17
-
18
-
19
-
20
-
21
-
22
-
23
-
24
-
25
-
26
-
27
-
28
-
29
-
30
-
31
-
32
-
33
-
34
-
35
-
 36
36 -
 37
37 -
 38
38 -
 39
39 -
 40
40 -
 41
41 -
 42
42 -
 43
43 -
 44
44 -
 45
45 -
 46
46 -
 47
47 -
 48
48 -
 49
49 -
 50
50 -
 51
51 -
 52
52 -
 53
53 -
 54
54 -
 55
55 -
 56
56 -
57
-
58
-
59
-
60
-
61
-
62
-
63
-
64
-
65
-
66
-
67
-
68
 |
 |

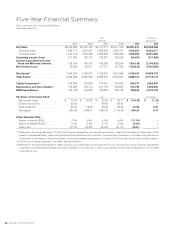
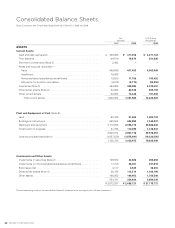
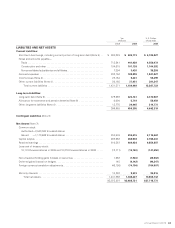
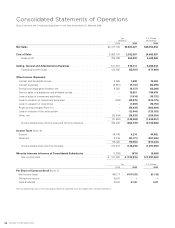
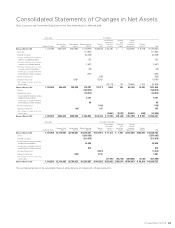
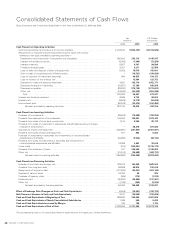
Sharp Corporation and Consolidated Subsidiaries for the Years Ended March 31, 2008 and 2009
Yen
(millions)
U.S. Dollars
(thousands)
2008 2009 2009
Net Sales . . . . . . . . . . . . . . . . . . . . . . . . . . . . . . . . . . . . . . . . . . . . . . . . . . . . . . . . ¥3,417,736 ¥2,847,227 $29,352,856
Cost of Sales . . . . . . . . . . . . . . . . . . . . . . . . . . . . . . . . . . . . . . . . . . . . . . . . . . . . . 2,662,707 2,392,397 24,663,887
Gross profit . . . . . . . . . . . . . . . . . . . . . . . . . . . . . . . . . . . . . . . . . . . . . . . . . . . 755,029 454,830 4,688,969
Selling, General and Administrative Expenses . . . . . . . . . . . . . . . . . . . . . . . . . 571,337 510,311 5,260,938
Operating income (loss) . . . . . . . . . . . . . . . . . . . . . . . . . . . . . . . . . . . . . . . . . 183,692 (55,481) (571,969)
Other Income (Expenses):
Interest and dividends income . . . . . . . . . . . . . . . . . . . . . . . . . . . . . . . . . . . . . . 8,086 7,009 72,258
Interest expenses . . . . . . . . . . . . . . . . . . . . . . . . . . . . . . . . . . . . . . . . . . . . . . . . (9,957) (9,147) (94,299)
Foreign exchange gains (losses), net . . . . . . . . . . . . . . . . . . . . . . . . . . . . . . . . . 9,562 (6,137) (63,268)
Gain on sales of subsidiaries and affiliates’ stocks . . . . . . . . . . . . . . . . . . . . . . . – 18,521 190,938
Loss on sales of investment securities. . . . . . . . . . . . . . . . . . . . . . . . . . . . . . . . – (1,914) (19,732)
Loss on valuation of investment securities. . . . . . . . . . . . . . . . . . . . . . . . . . . . . (694) (49,875) (514,175)
Loss on valuation of inventories . . . . . . . . . . . . . . . . . . . . . . . . . . . . . . . . . . . . . – (7,639) (78,753)
Restructuring charges (Note 11) . . . . . . . . . . . . . . . . . . . . . . . . . . . . . . . . . . . . . – (58,439) (602,464)
Loss on violation of the antitrust law . . . . . . . . . . . . . . . . . . . . . . . . . . . . . . . . . – (12,004) (123,753)
Other, net . . . . . . . . . . . . . . . . . . . . . . . . . . . . . . . . . . . . . . . . . . . . . . . . . . . . . . (28,449) (29,033) (299,309)
(21,452) (148,658) (1,532,557)
Income (loss) before income taxes and minority interests . . . . . . . . . . . . . . . 162,240 (204,139) (2,104,526)
Income Taxes (Note 4):
Current . . . . . . . . . . . . . . . . . . . . . . . . . . . . . . . . . . . . . . . . . . . . . . . . . . . . . . . . 49,746 4,274 44,062
Deferred . . . . . . . . . . . . . . . . . . . . . . . . . . . . . . . . . . . . . . . . . . . . . . . . . . . . . . . 9,276 (83,177) (857,495)
59,022 (78,903) (813,433)
Income (loss) before minority interests. . . . . . . . . . . . . . . . . . . . . . . . . . . . . . 103,218 (125,236) (1,291,093)
Minority Interests in Income of Consolidated Subsidiaries . . . . . . . . . . . . . . . (1,296) (579) (5,969)
Net income (loss) . . . . . . . . . . . . . . . . . . . . . . . . . . . . . . . . . . . . . . . . . . . . . . ¥ 101,922 ¥ (125,815) $ (1,297,062)
Yen U.S. Dollars
2008 2009 2009
Per Share of Common Stock (Note 7):
Net income (loss) . . . . . . . . . . . . . . . . . . . . . . . . . . . . . . . . . . . . . . . . . . . . . . . . ¥93.17 ¥(114.33) $(1.18)
Diluted net income . . . . . . . . . . . . . . . . . . . . . . . . . . . . . . . . . . . . . . . . . . . . . . . 86.91 – –
Cash dividends . . . . . . . . . . . . . . . . . . . . . . . . . . . . . . . . . . . . . . . . . . . . . . . . . . 28.00 21.00 0.22
The accompanying notes to the consolidated financial statements are an integral part of these statements.