Sharp 2009 Annual Report Download - page 55
Download and view the complete annual report
Please find page 55 of the 2009 Sharp annual report below. You can navigate through the pages in the report by either clicking on the pages listed below, or by using the keyword search tool below to find specific information within the annual report.-
 1
1 -
2
-
3
-
4
-
5
-
6
-
7
-
8
-
9
-
10
-
11
-
12
-
13
-
14
-
15
-
16
-
17
-
18
-
19
-
20
-
21
-
22
-
23
-
24
-
25
-
26
-
27
-
28
-
29
-
30
-
31
-
32
-
33
-
34
-
35
-
36
-
37
-
38
-
39
-
40
-
41
-
42
-
43
-
44
-
 45
45 -
 46
46 -
 47
47 -
 48
48 -
 49
49 -
 50
50 -
 51
51 -
 52
52 -
 53
53 -
 54
54 -
 55
55 -
 56
56 -
 57
57 -
 58
58 -
 59
59 -
 60
60 -
 61
61 -
 62
62 -
 63
63 -
 64
64 -
 65
65 -
66
-
67
-
68
 |
 |

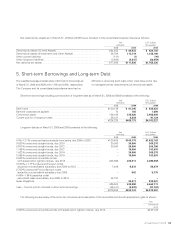
difficulty in renewing such loans when loans have come due
or management has determined such renewal advisable.
The weighted average interest rates of short-term borrowings as
of March 31, 2008 and 2009 were 1.9% and 0.8%, respectively.
The Company and its consolidated subsidiaries have had no
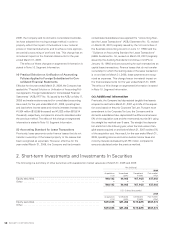
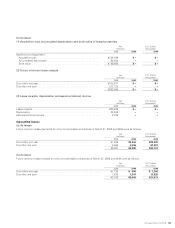
5. Short-term Borrowings and Long-term Debt
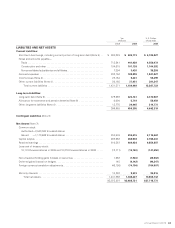
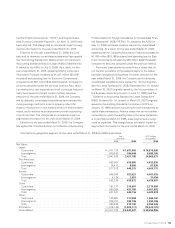
Short-term borrowings including current portion of long-term debt as of March 31, 2008 and 2009 consisted of the following:
Yen
(millions)
U.S. Dollars
(thousands)
2008 2009 2009
Bank loans . . . . . . . . . . . . . . . . . . . . . . . . . . . . . . . . . . . . . . . . . . . . . . . . . . . . . ¥120,139 ¥ 61,345 $ 632,423
Bankers’ acceptances payable . . . . . . . . . . . . . . . . . . . . . . . . . . . . . . . . . . . . . . 10 163 1,680
Commercial paper . . . . . . . . . . . . . . . . . . . . . . . . . . . . . . . . . . . . . . . . . . . . . . . 158,168 335,426 3,458,000
Current portion of long-term debt. . . . . . . . . . . . . . . . . . . . . . . . . . . . . . . . . . . . 46,011 8,839 91,124
¥324,328 ¥405,773 $4,183,227
Long-term debt as of March 31, 2008 and 2009 consisted of the following:
Yen
(millions)
U.S. Dollars
(thousands)
2008 2009 2009
0.0%–12.1% unsecured loans principally from banks, due 2008 to 2020 . . . . . . . ¥120,488 ¥100,178 $1,032,763
0.620% unsecured straight bonds, due 2010 . . . . . . . . . . . . . . . . . . . . . . . . . . 30,000 30,000 309,278
0.970% unsecured straight bonds, due 2012 . . . . . . . . . . . . . . . . . . . . . . . . . . 20,000 20,000 206,186
1.165% unsecured straight bonds, due 2012 . . . . . . . . . . . . . . . . . . . . . . . . . . – 10,000 103,093
1.423% unsecured straight bonds, due 2014 . . . . . . . . . . . . . . . . . . . . . . . . . . – 30,000 309,278
2.068% unsecured straight bonds, due 2019 . . . . . . . . . . . . . . . . . . . . . . . . . . – 10,000 103,093
0.000% unsecured convertible bonds
with subscription rights to shares, due 2013 . . . . . . . . . . . . . . . . . . . . . . . . . . 203,926 203,211 2,094,959
0.320%–1.177% unsecured Euroyen notes
issued by a consolidated subsidiary, due 2008 to 2013 . . . . . . . . . . . . . . . . . . 7,409 5,818 59,979
0.700% unsecured Pound discount notes
issued by a consolidated subsidiary, due 2009. . . . . . . . . . . . . . . . . . . . . . . . . – 502 5,175
0.48%–1.54% payables under
securitized lease receivables, due 2008 to 2014 . . . . . . . . . . . . . . . . . . . . . . . 43,781 – –
lease obligations. . . . . . . . . . . . . . . . . . . . . . . . . . . . . . . . . . . . . . . . . . . . . . . . . – 23,271 239,907
425,604 432,980 4,463,711
Less – Current portion included in short-term borrowings . . . . . . . . . . . . . . . . . (46,011) (8,839) (91,124)
¥379,593 ¥424,141 $4,372,587
The following is a summary of the terms for conversion and redemption of the convertible bonds with subscription rights to shares:
Yen
Conversion
price
0.000% unsecured convertible bonds with subscription rights to shares, due 2013. . . . . . . . . . . . . . . . . . . . . . . . . . ¥2,531.00
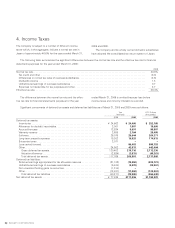
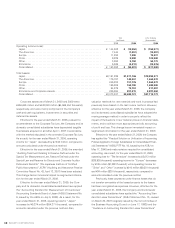
Net deferred tax assets as of March 31, 2008 and 2009 were included in the consolidated balance sheets as follows:
Yen
(millions)
U.S. Dollars
(thousands)
2008 2009 2009
Deferred tax assets (Current Assets) . . . . . . . . . . . . . . . . . . . . . . . . . . . . . . . . . ¥54,453 ¥ 60,538 $ 624,103
Deferred tax assets (Investments and Other Assets) . . . . . . . . . . . . . . . . . . . . 26,794 113,314 1,168,186
Other current liabilities . . . . . . . . . . . . . . . . . . . . . . . . . . . . . . . . . . . . . . . . . . . . (141) (1) (10)
Other long-term liabilities . . . . . . . . . . . . . . . . . . . . . . . . . . . . . . . . . . . . . . . . . . (3,608) (2,615) (26,959)
Net deferred tax assets . . . . . . . . . . . . . . . . . . . . . . . . . . . . . . . . . . . . . . . . . . . ¥77,498 ¥171,236 $1,765,320