Sharp 2009 Annual Report Download - page 21
Download and view the complete annual report
Please find page 21 of the 2009 Sharp annual report below. You can navigate through the pages in the report by either clicking on the pages listed below, or by using the keyword search tool below to find specific information within the annual report.-
 1
1 -
2
-
3
-
4
-
5
-
6
-
7
-
8
-
9
-
10
-
 11
11 -
 12
12 -
 13
13 -
 14
14 -
 15
15 -
 16
16 -
 17
17 -
 18
18 -
 19
19 -
 20
20 -
 21
21 -
 22
22 -
 23
23 -
 24
24 -
 25
25 -
 26
26 -
 27
27 -
 28
28 -
 29
29 -
 30
30 -
 31
31 -
32
-
33
-
34
-
35
-
36
-
37
-
38
-
39
-
40
-
41
-
42
-
43
-
44
-
45
-
46
-
47
-
48
-
49
-
50
-
51
-
52
-
53
-
54
-
55
-
56
-
57
-
58
-
59
-
60
-
61
-
62
-
63
-
64
-
65
-
66
-
67
-
68
 |
 |

3,000
2,000
1,000
05
0
06 07 08 09
05 06 07 08 09
3,000
2,000
1,000
0
05
–50
0
50
100
150
06 07 08 09
150
100
50
0
05
–50
06 07 08 09
2,000
1,500
1,000
500
05
0
06 07 08 09
2,000
1,500
1,000
500
05
0
06 07 08 09
300
200
100
05
0
06 07 08 09
300
200
100
05
0
06 07 08 09
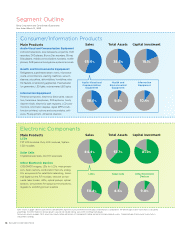
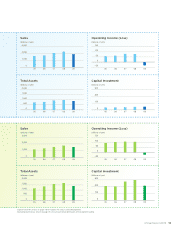
Sales
(billions of yen)
Sales
(billions of yen)
Operating Income (Loss)
(billions of yen)
Operating Income (Loss)
(billions of yen)
Total Assets
(billions of yen)
Total Assets
(billions of yen)
Capital Investment
(billions of yen)
Capital Investment
(billions of yen)
· Capital investment shown on pages 18-19 includes the amount of leased properties.
· Operating income (loss) shown on page 19 is the amount before elimination of intersegment trading.