Sharp 2009 Annual Report Download - page 47
Download and view the complete annual report
Please find page 47 of the 2009 Sharp annual report below. You can navigate through the pages in the report by either clicking on the pages listed below, or by using the keyword search tool below to find specific information within the annual report.-
 1
1 -
2
-
3
-
4
-
5
-
6
-
7
-
8
-
9
-
10
-
11
-
12
-
13
-
14
-
15
-
16
-
17
-
18
-
19
-
20
-
21
-
22
-
23
-
24
-
25
-
26
-
27
-
28
-
29
-
30
-
31
-
32
-
33
-
34
-
35
-
36
-
 37
37 -
 38
38 -
 39
39 -
 40
40 -
 41
41 -
 42
42 -
 43
43 -
 44
44 -
 45
45 -
 46
46 -
 47
47 -
 48
48 -
 49
49 -
 50
50 -
 51
51 -
 52
52 -
 53
53 -
 54
54 -
 55
55 -
 56
56 -
 57
57 -
58
-
59
-
60
-
61
-
62
-
63
-
64
-
65
-
66
-
67
-
68
 |
 |

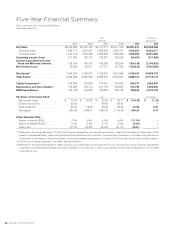
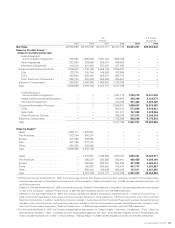
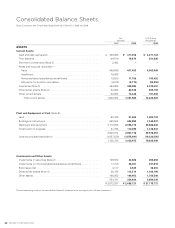
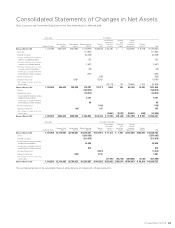
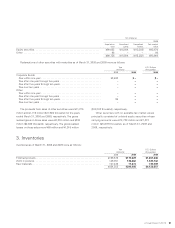
Sharp Corporation and Consolidated Subsidiaries for the Years Ended March 31, 2008 and 2009
(thousands) Yen (millions)
Number of shares
Common stock
(Note 7)
Capital surplus
(Note 7)
Retained earnings
(Note 7)
Treasury
stock
Net unrealized
holding gains
(losses) on
securities
Deferred
gains
(losses) on
hedges
Foreign
currency
translation
adjustments
Minority
interests Total
Balance at March 31, 2007
1,110,699 ¥ 204,676 ¥ 262,295 ¥ 745,209 ¥ (26,844) ¥ 24,381 ¥ 1 ¥ (26,591) ¥ 9,078 ¥ 1,192,205
Net income
101,922 101,922
Dividends from surplus
(30,538) (30,538)
Increase resulting from increase in
number of consolidated subsidiaries
192 192
D e cre a se r e sul t ing f rom incr e ase
in number of consolidated subsidiaries
(1,597) (1,597)
D e cre a se r e sul t ing f rom incr e ase
in number of equity method affiliates
(29) (29)
Increase due to unfunded retirement
benefit obligation of foreign subsidiaries
1,228 1,228
Purchase of treasury stock
(369) (369)
Disposal of treasury stock
6,287 13,502 19,789
N et c han g es o f i t ems othe r t h an
owners’ equity
(22,719) 144 (19,564) 1,204 (40,935)
Balance at March 31, 2008
1,110,699 204,676 268,582 816,387 (13,711) 1,662 145 (46,155) 10,282 1,241,868
Net loss
(125,815) (125,815)
Dividends from surplus
(30,814) (30,814)
Increase resulting from change in accounting
standards of foreign subsidiaries
5,101 5,101
Increase due to unfunded retirement
benefit obligation of foreign subsidiaries
65 65
Purchase of treasury stock
(176) (176)
Disposal of treasury stock
(44) 147 103
N et c han g es o f i t ems othe r t h an
owners’ equity
(3,608) (9,287) (28,041) (949) (41,885)
Balance at March 31, 2009
1,110,699 ¥204,676 ¥268,538 ¥ 664,924 ¥(13,740) ¥ (1,946) ¥(9,142) ¥(74,196) ¥ 9,333 ¥1,048,447
(thousands) U.S. Dollars (thousands)
Number of shares
Common stock
(Note 7)
Capital surplus
(Note 7)
Retained earnings
(Note 7)
Treasury
stock
Net unrealized
holding gains
(losses) on
securities
Deferred
gains
(losses) on
hedges
Foreign
currency
translation
adjustments
Minority
interests Total
Balance at March 31, 2008
1,110,699 $2,110,062 $2,768,887 $ 8,416,361 $(141,351) $ 17,134 $ 1,495 $(475,825) $106,000 $12,802,763
Net loss
(1,297,062) (1,297,062)
Dividends from surplus
(317,670) (317,670)
Increase resulting from change in accounting
standards of foreign subsidiaries
52,588 52,588
Increase due to unfunded retirement
benefit obligation of foreign subsidiaries
670 670
Purchase of treasury stock
(1,814) (1,814)
Disposal of treasury stock
(454) 1,515 1,061
N et c han g es o f i t ems othe r th an
owners’ equity
(37,196) (95,742) (289,082) (9,784) (431,804)
Balance at March 31, 2009
1,110,699 $2,110,062 $2,768,433 $ 6,854,887 $(141,650) $(20,062) $(94,247) $(764,907) $ 96,216 $10,808,732
The accompanying notes to the consolidated financial statements are an integral part of these statements.