Seagate 2002 Annual Report Download - page 33
Download and view the complete annual report
Please find page 33 of the 2002 Seagate annual report below. You can navigate through the pages in the report by either clicking on the pages listed below, or by using the keyword search tool below to find specific information within the annual report.
Results of Operations
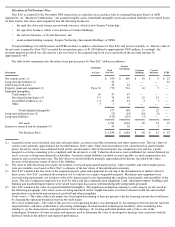
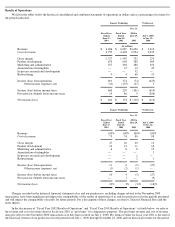
We list in the tables below the historical consolidated and combined statements of operations in dollars and as a percentage of revenue for
the periods indicated.
Charges recorded in the historical financial statements of us and our predecessor, including charges related to the November 2000
transactions, have been significant and impact the comparability of the results of operations of us and our predecessor for the periods presented
and will impact the comparability of results for future periods. For a description of these charges, see Item 6. Selected Financial Data and the
notes thereto.
In the discussions of “Fiscal Year 2002 Results of Operations” and “Fiscal Year 2001 Results of Operations” set forth below, we refer to
the revenue and cost of revenue data for fiscal year 2001 as “pro forma” for comparative purposes. The pro forma revenue and cost of revenue
data give effect to the November 2000 transactions as if they had occurred on July 1, 2000. Pro forma revenue for fiscal year 2001 is the sum of
the historical revenue of our predecessor for the period from July 1, 2000 through November 22, 2000 and our historical revenue for the period
Seagate Technology
Predecessor
Fiscal Year
Ended
June 27,
2003
Fiscal Year
Ended
June 28,
2002
Nov. 23,
2000 to
June 29,
2001
July 1, 2000
to Nov. 22,
2000
(in millions)
Revenue
$
6,486
$
6,087
$
3,656
$
2,310
Cost of revenue
4,759
4,494
2,924
2,035
Gross margin
1,727
1,593
732
275
Product development
670
698
388
409
Marketing and administrative
357
498
288
450
Amortization of intangibles
—
19
12
20
In
-
process research and development
—
—
52
—
Restructuring
9
4
66
19
Income (loss) from operations
691
374
(74
)
(623
)
Other income (expense), net
(31
)
(135
)
(27
)
5
Income (loss) before income taxes
660
239
(101
)
(618
)
Provision for (benefit from) income taxes
19
86
9
(206
)
Net income (loss)
$
641
$
153
$
(110
)
$
(412
)
Seagate Technology
Predecessor
Fiscal Year
Ended
June 27,
2003
Fiscal Year
Ended
June 28,
2002
Nov. 23,
2000 to
June 29,
2001
July 1, 2000
to Nov. 22,
2000
Revenue
100
%
100
%
100
%
100
%
Cost of revenue
73
74
80
88
Gross margin
27
26
20
12
Product development
10
12
11
18
Marketing and administrative
6
8
8
19
Amortization of intangibles
—
—
—
1
In
-
process research and development
—
—
1
—
Restructuring
—
—
2
1
Income (loss) from operations
11
6
(2
)
(27
)
Other income (expense), net
(1
)
(2
)
(1
)
—
Income (loss) before income taxes
10
4
(3
)
(27
)
Provision for (benefit from) income taxes
—
1
—
(
9
)
Net income (loss)
10
%
3
%
(3
)%
(18
)%


