Regions Bank 2011 Annual Report Download - page 233
Download and view the complete annual report
Please find page 233 of the 2011 Regions Bank annual report below. You can navigate through the pages in the report by either clicking on the pages listed below, or by using the keyword search tool below to find specific information within the annual report.-
 1
1 -
2
-
3
-
4
-
5
-
6
-
7
-
8
-
9
-
10
-
11
-
12
-
13
-
14
-
15
-
16
-
17
-
18
-
19
-
20
-
21
-
22
-
23
-
24
-
25
-
26
-
27
-
28
-
29
-
30
-
31
-
32
-
33
-
34
-
35
-
36
-
37
-
38
-
39
-
40
-
41
-
42
-
43
-
44
-
45
-
46
-
47
-
48
-
49
-
50
-
51
-
52
-
53
-
54
-
55
-
56
-
57
-
58
-
59
-
60
-
61
-
62
-
63
-
64
-
65
-
66
-
67
-
68
-
69
-
70
-
71
-
72
-
73
-
74
-
75
-
76
-
77
-
78
-
79
-
80
-
81
-
82
-
83
-
84
-
85
-
86
-
87
-
88
-
89
-
90
-
91
-
92
-
93
-
94
-
95
-
96
-
97
-
98
-
99
-
100
-
101
-
102
-
103
-
104
-
105
-
106
-
107
-
108
-
109
-
110
-
111
-
112
-
113
-
114
-
115
-
116
-
117
-
118
-
119
-
120
-
121
-
122
-
123
-
124
-
125
-
126
-
127
-
128
-
129
-
130
-
131
-
132
-
133
-
134
-
135
-
136
-
137
-
138
-
139
-
140
-
141
-
142
-
143
-
144
-
145
-
146
-
147
-
148
-
149
-
150
-
151
-
152
-
153
-
154
-
155
-
156
-
157
-
158
-
159
-
160
-
161
-
162
-
163
-
164
-
165
-
166
-
167
-
168
-
169
-
170
-
171
-
172
-
173
-
174
-
175
-
176
-
177
-
178
-
179
-
180
-
181
-
182
-
183
-
184
-
185
-
186
-
187
-
188
-
189
-
190
-
191
-
192
-
193
-
194
-
195
-
196
-
197
-
198
-
199
-
200
-
201
-
202
-
203
-
204
-
205
-
206
-
207
-
208
-
209
-
210
-
211
-
212
-
213
-
214
-
215
-
216
-
217
-
218
-
219
-
220
-
221
-
222
-
 223
223 -
 224
224 -
 225
225 -
 226
226 -
 227
227 -
 228
228 -
 229
229 -
 230
230 -
 231
231 -
 232
232 -
 233
233 -
 234
234 -
 235
235 -
 236
236 -
 237
237 -
 238
238 -
 239
239 -
 240
240 -
 241
241 -
 242
242 -
 243
243 -
244
-
245
-
246
-
247
-
248
-
249
-
250
-
251
-
252
-
253
-
254
-
255
-
256
-
257
-
258
-
259
-
260
-
261
-
262
-
263
-
264
-
265
-
266
-
267
-
268
 |
 |

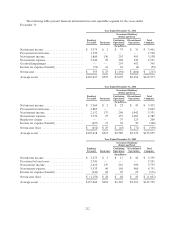
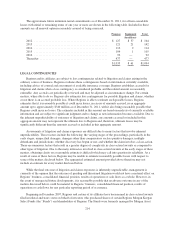
Year Ended December 31, 2009
Balance
January 1,
2009
Total Realized / Unrealized
Gains or Losses
Purchases/
Issuances Settlements
Transfers
into / out
of
Level 3
Balance
December 31,
2009
Net change
in unrealized
gains (losses)
included in
earnings
related to
assets and
liabilities
held at
December 31,
2009
Included
in
Earnings
Included in
Other
Comprehensive
Income (Loss)
Level 3 Instruments Only (In millions)
Trading account assets, net
(f)(g) ............... $275 $ (9)(a) $— $ 40 $ (96) $ 4 $214 $—
Securities available for
sale ................ 95 (13)(c) 3 — (32) — 53 (15)(c)
Mortgage servicing
rights ............... 161 (15)(b) — 101 — — 247 19 (b)
Derivatives, net ......... 55 51(d) — — (103) — 3 80 (e)
(a) Included in discontinued operations, on a net basis.
(b) Included in mortgage income.
(c) Included in other non-interest income.
(d) Approximately ($34) million included in discontinued operations, on a net basis and approximately $85 million included in mortgage
income.
(e) Approximately ($5) million included in discontinued operations, on a net basis and approximately $85 million included in mortgage
income.
(f) Income from trading account assets primarily represents gains/(losses) on disposition, which inherently includes commissions on security
transactions during the period.
(g) All amounts related to trading account assets and trading account liabilities are related to Morgan Keegan (see Note 3 and 25 for
discussion of pending sale of Morgan Keegan).
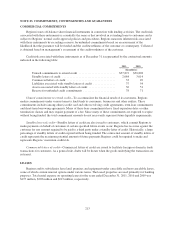
The following table presents the carrying value and the level of valuation assumptions of those assets
measured at fair value on a non-recurring basis as of December 31:
2011 2010
Level 1 Level 2 Level 3 Total Level 1 Level 2 Level 3 Total
(In millions)
Loans held for sale ...................... $— $36 $195 $231 $— $238 $ 31 $269
Foreclosed property, other real estate and
equipment ........................... — 91 162 253 — 201 152 353
The following table presents the fair value adjustments related to non-recurring fair value measurements:
2011 2010
(In millions)
Loans held for sale .................................... $(611) $(259)
Foreclosed property, other real estate and equipment ......... (229) (218)
FAIR VALUE OPTION
Regions elected the fair value option for FNMA and FHLMC eligible thirty-year residential mortgage loans
held for sale originated on or after January 1, 2008. Additionally, Regions elected the fair value option for
FNMA and FHLMC eligible fifteen-year residential mortgage loans originated on or after November 22, 2010.
These elections allow for a more effective offset of the changes in fair values of the loans and the derivative
instruments used to economically hedge them without the burden of complying with the requirements for hedge
accounting. Regions has not elected the fair value option for other loans held for sale primarily because they are
not economically hedged using derivative instruments. Fair values of mortgage loans held for sale are based on
traded market prices of similar assets where available and/or discounted cash flows at market interest rates,
adjusted for securitization activities that include servicing values and market conditions, and were recorded in
loans held for sale in the consolidated balance sheets.
209