Regions Bank 2011 Annual Report Download - page 183
Download and view the complete annual report
Please find page 183 of the 2011 Regions Bank annual report below. You can navigate through the pages in the report by either clicking on the pages listed below, or by using the keyword search tool below to find specific information within the annual report.-
 1
1 -
2
-
3
-
4
-
5
-
6
-
7
-
8
-
9
-
10
-
11
-
12
-
13
-
14
-
15
-
16
-
17
-
18
-
19
-
20
-
21
-
22
-
23
-
24
-
25
-
26
-
27
-
28
-
29
-
30
-
31
-
32
-
33
-
34
-
35
-
36
-
37
-
38
-
39
-
40
-
41
-
42
-
43
-
44
-
45
-
46
-
47
-
48
-
49
-
50
-
51
-
52
-
53
-
54
-
55
-
56
-
57
-
58
-
59
-
60
-
61
-
62
-
63
-
64
-
65
-
66
-
67
-
68
-
69
-
70
-
71
-
72
-
73
-
74
-
75
-
76
-
77
-
78
-
79
-
80
-
81
-
82
-
83
-
84
-
85
-
86
-
87
-
88
-
89
-
90
-
91
-
92
-
93
-
94
-
95
-
96
-
97
-
98
-
99
-
100
-
101
-
102
-
103
-
104
-
105
-
106
-
107
-
108
-
109
-
110
-
111
-
112
-
113
-
114
-
115
-
116
-
117
-
118
-
119
-
120
-
121
-
122
-
123
-
124
-
125
-
126
-
127
-
128
-
129
-
130
-
131
-
132
-
133
-
134
-
135
-
136
-
137
-
138
-
139
-
140
-
141
-
142
-
143
-
144
-
145
-
146
-
147
-
148
-
149
-
150
-
151
-
152
-
153
-
154
-
155
-
156
-
157
-
158
-
159
-
160
-
161
-
162
-
163
-
164
-
165
-
166
-
167
-
168
-
169
-
170
-
171
-
172
-
 173
173 -
 174
174 -
 175
175 -
 176
176 -
 177
177 -
 178
178 -
 179
179 -
 180
180 -
 181
181 -
 182
182 -
 183
183 -
 184
184 -
 185
185 -
 186
186 -
 187
187 -
 188
188 -
 189
189 -
 190
190 -
 191
191 -
 192
192 -
 193
193 -
194
-
195
-
196
-
197
-
198
-
199
-
200
-
201
-
202
-
203
-
204
-
205
-
206
-
207
-
208
-
209
-
210
-
211
-
212
-
213
-
214
-
215
-
216
-
217
-
218
-
219
-
220
-
221
-
222
-
223
-
224
-
225
-
226
-
227
-
228
-
229
-
230
-
231
-
232
-
233
-
234
-
235
-
236
-
237
-
238
-
239
-
240
-
241
-
242
-
243
-
244
-
245
-
246
-
247
-
248
-
249
-
250
-
251
-
252
-
253
-
254
-
255
-
256
-
257
-
258
-
259
-
260
-
261
-
262
-
263
-
264
-
265
-
266
-
267
-
268
 |
 |

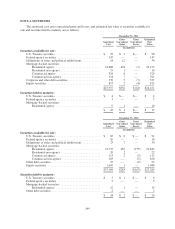
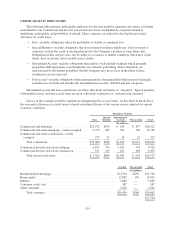
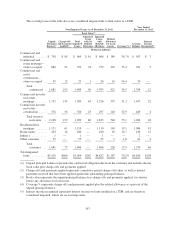
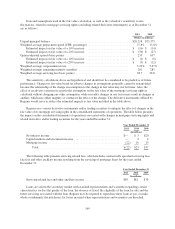
CREDIT QUALITY INDICATORS
The following tables present credit quality indicators for the loan portfolio segments and classes, excluding
loans held for sale. Commercial and investor real estate loan classes are detailed by categories related to
underlying credit quality and probability of default. These categories are utilized to develop the associated
allowance for credit losses.
• Pass—includes obligations where the probability of default is considered low;
• Special Mention—includes obligations that have potential weakness which may, if not reversed or
corrected, weaken the credit or inadequately protect the Company’s position at some future date.
Obligations in this category may also be subject to economic or market conditions which may, in the
future, have an adverse affect on debt service ability;
• Substandard Accrual—includes obligations that exhibit a well-defined weakness which presently
jeopardizes debt repayment, even though they are currently performing. These obligations are
characterized by the distinct possibility that the Company may incur a loss in the future if these
weaknesses are not corrected;
• Non-accrual—includes obligations where management has determined that full payment of principal
and interest is in doubt and includes the substandard non-accrual, doubtful and loss categories.
Substandard accrual and non-accrual loans are often collectively referred to as “classified.” Special mention,
substandard accrual, and non-accrual loans are often collectively referred to as “criticized and classified.”
Classes in the consumer portfolio segment are disaggregated by accrual status. As described in detail above,
the associated allowance for credit losses is based on historical losses of the various classes adjusted for current
economic conditions.
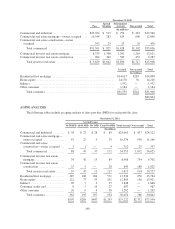
December 31, 2011
Pass
Special
Mention
Substandard
Accrual Non-accrual Total
(In millions)
Commercial and industrial ....................... $22,952 $479 $ 634 $ 457 $24,522
Commercial real estate mortgage—owner occupied . . . 9,773 262 541 590 11,166
Commercial real estate construction—owner
occupied ................................... 275 27 10 25 337
Total commercial .......................... $33,000 $768 $1,185 $1,072 $36,025
Commerical investor real estate mortgage ........... 6,851 756 1,361 734 9,702
Commercial investor real estate construction ......... 531 113 201 180 1,025
Total investor real estate ..................... $ 7,382 $869 $1,562 $ 914 $10,727
Accrual Non-accrual Total
(In millions)
Residential first mortgage .......................................... $13,534 $250 $13,784
Home equity ..................................................... 12,885 136 13,021
Indirect ......................................................... 1,848 — 1,848
Consumer credit card .............................................. 987 — 987
Other consumer .................................................. 1,202 — 1,202
Total consumer ............................................... $30,456 $386 $30,842
$77,594
159