Regions Bank 2011 Annual Report Download - page 118
Download and view the complete annual report
Please find page 118 of the 2011 Regions Bank annual report below. You can navigate through the pages in the report by either clicking on the pages listed below, or by using the keyword search tool below to find specific information within the annual report.-
 1
1 -
2
-
3
-
4
-
5
-
6
-
7
-
8
-
9
-
10
-
11
-
12
-
13
-
14
-
15
-
16
-
17
-
18
-
19
-
20
-
21
-
22
-
23
-
24
-
25
-
26
-
27
-
28
-
29
-
30
-
31
-
32
-
33
-
34
-
35
-
36
-
37
-
38
-
39
-
40
-
41
-
42
-
43
-
44
-
45
-
46
-
47
-
48
-
49
-
50
-
51
-
52
-
53
-
54
-
55
-
56
-
57
-
58
-
59
-
60
-
61
-
62
-
63
-
64
-
65
-
66
-
67
-
68
-
69
-
70
-
71
-
72
-
73
-
74
-
75
-
76
-
77
-
78
-
79
-
80
-
81
-
82
-
83
-
84
-
85
-
86
-
87
-
88
-
89
-
90
-
91
-
92
-
93
-
94
-
95
-
96
-
97
-
98
-
99
-
100
-
101
-
102
-
103
-
104
-
105
-
106
-
107
-
 108
108 -
 109
109 -
 110
110 -
 111
111 -
 112
112 -
 113
113 -
 114
114 -
 115
115 -
 116
116 -
 117
117 -
 118
118 -
 119
119 -
 120
120 -
 121
121 -
 122
122 -
 123
123 -
 124
124 -
 125
125 -
 126
126 -
 127
127 -
 128
128 -
129
-
130
-
131
-
132
-
133
-
134
-
135
-
136
-
137
-
138
-
139
-
140
-
141
-
142
-
143
-
144
-
145
-
146
-
147
-
148
-
149
-
150
-
151
-
152
-
153
-
154
-
155
-
156
-
157
-
158
-
159
-
160
-
161
-
162
-
163
-
164
-
165
-
166
-
167
-
168
-
169
-
170
-
171
-
172
-
173
-
174
-
175
-
176
-
177
-
178
-
179
-
180
-
181
-
182
-
183
-
184
-
185
-
186
-
187
-
188
-
189
-
190
-
191
-
192
-
193
-
194
-
195
-
196
-
197
-
198
-
199
-
200
-
201
-
202
-
203
-
204
-
205
-
206
-
207
-
208
-
209
-
210
-
211
-
212
-
213
-
214
-
215
-
216
-
217
-
218
-
219
-
220
-
221
-
222
-
223
-
224
-
225
-
226
-
227
-
228
-
229
-
230
-
231
-
232
-
233
-
234
-
235
-
236
-
237
-
238
-
239
-
240
-
241
-
242
-
243
-
244
-
245
-
246
-
247
-
248
-
249
-
250
-
251
-
252
-
253
-
254
-
255
-
256
-
257
-
258
-
259
-
260
-
261
-
262
-
263
-
264
-
265
-
266
-
267
-
268
 |
 |

2007
(In millions)
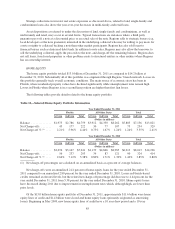
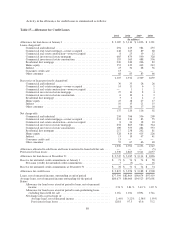
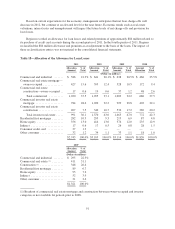
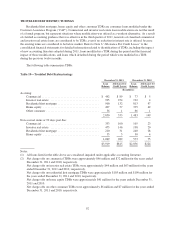
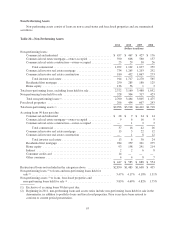
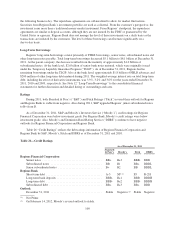
Non-performing loans:
Commercial and industrial ....................................................... $ 92
Commercial real estate (2) ........................................................ 263
Construction (2) ................................................................ 310
Residential first mortgage ........................................................ 72
Home equity .................................................................. 7
Total non-performing loans .......................................................... 744
Foreclosed properties ............................................................... 120
Total non-performing assets (1) .................................................... $864
Non-performing loans (1) to loans ...................................................... 0.78%
Non-performing assets (1) to loans, and foreclosed properties ................................ 0.90%
Accruing loans 90 days past due:
Commercial and industrial ....................................................... $ 12
Commercial real estate (2) ........................................................ 12
Construction (2) ................................................................ 19
Residential first mortgage ........................................................ 155
Home equity .................................................................. 147
Indirect ...................................................................... 6
Other consumer ............................................................... 6
$ 357
(1) Exclusive of accruing loans 90 days past due.
(2) Breakout of commercial real estate mortgage and construction between owner occupied and investor
categories not available for periods prior to 2008.
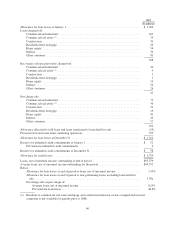
Non-performing assets totaled $3.0 billion at December 31, 2011, compared to $3.9 billion at December 31,
2010. Foreclosed properties, a subset of non-performing assets, totaled $296 million and $454 million at
December 31, 2011 and December 31, 2010, respectively. The decrease in non-performing assets and foreclosed
properties during 2011 reflects the Company’s efforts to work through problem assets and reduce the riskiest
exposures.
Based on current expectations for the economy, management anticipates non-performing assets to decrease
in 2012, but remain elevated as compared to historical levels. Economic trends such as real estate valuations,
interest rates and unemployment, as well as the level of disposition activity, will impact the future level of
non-performing assets.
Loans past due 90 days or more and still accruing were $447 million at December 31, 2011, a decrease from
$585 million at December 31, 2010.
At December 31, 2011, Regions had approximately $500-$600 million of potential problem commercial and
investor real estate loans that were not included in non-accrual loans, but for which management had concerns as
to the ability of such borrowers to comply with their present loan repayment terms. This is a likely estimate of
the amount of loans that may migrate to non-accrual status in the next quarter.
In order to arrive at the estimate of potential problem loans, personnel from geographic regions forecast
certain larger dollar loans that may potentially be downgraded to non-accrual at a future time, depending on the
occurrence of future events. These personnel consider a variety of factors, including the borrower’s capacity and
willingness to meet the contractual repayment terms, make principal curtailments or provide additional collateral
94