Regions Bank 2011 Annual Report Download - page 227
Download and view the complete annual report
Please find page 227 of the 2011 Regions Bank annual report below. You can navigate through the pages in the report by either clicking on the pages listed below, or by using the keyword search tool below to find specific information within the annual report.-
 1
1 -
2
-
3
-
4
-
5
-
6
-
7
-
8
-
9
-
10
-
11
-
12
-
13
-
14
-
15
-
16
-
17
-
18
-
19
-
20
-
21
-
22
-
23
-
24
-
25
-
26
-
27
-
28
-
29
-
30
-
31
-
32
-
33
-
34
-
35
-
36
-
37
-
38
-
39
-
40
-
41
-
42
-
43
-
44
-
45
-
46
-
47
-
48
-
49
-
50
-
51
-
52
-
53
-
54
-
55
-
56
-
57
-
58
-
59
-
60
-
61
-
62
-
63
-
64
-
65
-
66
-
67
-
68
-
69
-
70
-
71
-
72
-
73
-
74
-
75
-
76
-
77
-
78
-
79
-
80
-
81
-
82
-
83
-
84
-
85
-
86
-
87
-
88
-
89
-
90
-
91
-
92
-
93
-
94
-
95
-
96
-
97
-
98
-
99
-
100
-
101
-
102
-
103
-
104
-
105
-
106
-
107
-
108
-
109
-
110
-
111
-
112
-
113
-
114
-
115
-
116
-
117
-
118
-
119
-
120
-
121
-
122
-
123
-
124
-
125
-
126
-
127
-
128
-
129
-
130
-
131
-
132
-
133
-
134
-
135
-
136
-
137
-
138
-
139
-
140
-
141
-
142
-
143
-
144
-
145
-
146
-
147
-
148
-
149
-
150
-
151
-
152
-
153
-
154
-
155
-
156
-
157
-
158
-
159
-
160
-
161
-
162
-
163
-
164
-
165
-
166
-
167
-
168
-
169
-
170
-
171
-
172
-
173
-
174
-
175
-
176
-
177
-
178
-
179
-
180
-
181
-
182
-
183
-
184
-
185
-
186
-
187
-
188
-
189
-
190
-
191
-
192
-
193
-
194
-
195
-
196
-
197
-
198
-
199
-
200
-
201
-
202
-
203
-
204
-
205
-
206
-
207
-
208
-
209
-
210
-
211
-
212
-
213
-
214
-
215
-
216
-
 217
217 -
 218
218 -
 219
219 -
 220
220 -
 221
221 -
 222
222 -
 223
223 -
 224
224 -
 225
225 -
 226
226 -
 227
227 -
 228
228 -
 229
229 -
 230
230 -
 231
231 -
 232
232 -
 233
233 -
 234
234 -
 235
235 -
 236
236 -
 237
237 -
238
-
239
-
240
-
241
-
242
-
243
-
244
-
245
-
246
-
247
-
248
-
249
-
250
-
251
-
252
-
253
-
254
-
255
-
256
-
257
-
258
-
259
-
260
-
261
-
262
-
263
-
264
-
265
-
266
-
267
-
268
 |
 |
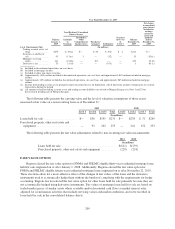
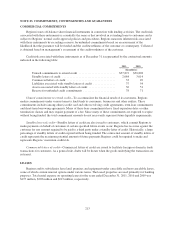
Credit risk, defined as all positive exposures not collateralized with cash or other assets, totaled
approximately $924 million and $1.0 billion at December 31, 2011 and 2010, respectively. This amount
represents the net credit risk on all trading and other derivative positions held by Regions.
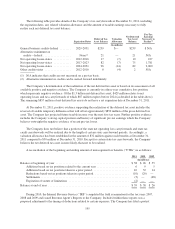
CREDIT DERIVATIVES
Regions has both bought and sold credit protection in the form of participations on interest rate swaps (swap
participations). These swap participations, which meet the definition of credit derivatives, were entered into in
the ordinary course of business to serve the credit needs of customers. Credit derivatives, whereby Regions has
purchased credit protection, entitle Regions to receive a payment from the counterparty when the customer fails
to make payment on any amounts due to Regions upon early termination of the swap transaction and have
maturities between 2012 and 2026. Credit derivatives whereby Regions has sold credit protection have maturities
between 2012 and 2018. For contracts where Regions sold credit protection, Regions would be required to make
payment to the counterparty when the customer fails to make payment on any amounts due to the counterparty
upon early termination of the swap transaction. Regions bases the current status of the prepayment/performance
risk on bought and sold credit derivatives on recently issued internal risk ratings consistent with the risk
management practices of unfunded commitments.
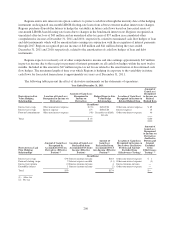
Regions’ maximum potential amount of future payments under these contracts as of December 31, 2011 is
approximately $30 million. This scenario would only occur if variable interest rates were at zero percent and all
counterparties defaulted with zero recovery. The fair value of sold protection at December 31, 2011 was
immaterial. In transactions where Regions has sold credit protection, recourse to collateral associated with the
original swap transaction is available to offset some or all of Regions’ obligation.
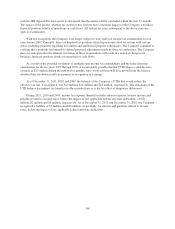
CONTINGENT FEATURES
Certain of Regions’ derivative instrument contracts with broker-dealers contain provisions allowing those
broker-dealers to terminate the contracts in the event that Regions’ and/or Regions Bank’s credit rating falls
below specified ratings from certain major credit rating agencies. At December 31, 2011, Moody’s Investor
Service (“Moody’s”) and Standard & Poor’s (“S&P”) credit ratings for Regions Financial Corporation were
below investment grade. For Regions Bank, Moody’s credit ratings were below investment grade. As a result of
these ratings, certain of Regions Bank’s broker-dealer counterparties could have terminated these contracts at
their discretion. In lieu of terminating the contracts, Regions Bank and certain of its broker-dealer counterparties
amended the contracts such that Regions Bank was required to post additional collateral in the cumulative
amount of $186 million to these counterparties as of December 31, 2011.
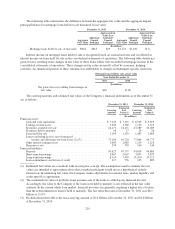
Some of these contracts with broker-dealers still contain credit-related termination provisions and/or credit-
related provisions regarding the posting of collateral. At December 31, 2011, the net fair value of such contracts
containing credit-related termination provisions that were in a liability position was $333 million, for which
Regions had posted collateral of $441 million. At December 31, 2011, the net fair value of contracts that do not
contain credit-related termination provisions that were in a liability position was $253 million for which Regions
had posted collateral of $251 million. Other derivative contracts with broker-dealers do not contain any credit-
related provisions. These counterparties require complete overnight collateralization.
The aggregate fair value of all derivative instruments with any credit-risk-related contingent features that
were in a liability position on December 31, 2011 and 2010, was $425 million and $508 million, respectively, for
which Regions had posted collateral of $531 million and $652 million, respectively, in the normal course of
business.
NOTE 21. FAIR VALUE MEASUREMENTS
Fair value guidance establishes a framework for using fair value to measure assets and liabilities and defines
fair value as the price that would be received to sell an asset or paid to transfer a liability (an exit price) as
203