Regions Bank 2011 Annual Report Download - page 139
Download and view the complete annual report
Please find page 139 of the 2011 Regions Bank annual report below. You can navigate through the pages in the report by either clicking on the pages listed below, or by using the keyword search tool below to find specific information within the annual report.-
 1
1 -
2
-
3
-
4
-
5
-
6
-
7
-
8
-
9
-
10
-
11
-
12
-
13
-
14
-
15
-
16
-
17
-
18
-
19
-
20
-
21
-
22
-
23
-
24
-
25
-
26
-
27
-
28
-
29
-
30
-
31
-
32
-
33
-
34
-
35
-
36
-
37
-
38
-
39
-
40
-
41
-
42
-
43
-
44
-
45
-
46
-
47
-
48
-
49
-
50
-
51
-
52
-
53
-
54
-
55
-
56
-
57
-
58
-
59
-
60
-
61
-
62
-
63
-
64
-
65
-
66
-
67
-
68
-
69
-
70
-
71
-
72
-
73
-
74
-
75
-
76
-
77
-
78
-
79
-
80
-
81
-
82
-
83
-
84
-
85
-
86
-
87
-
88
-
89
-
90
-
91
-
92
-
93
-
94
-
95
-
96
-
97
-
98
-
99
-
100
-
101
-
102
-
103
-
104
-
105
-
106
-
107
-
108
-
109
-
110
-
111
-
112
-
113
-
114
-
115
-
116
-
117
-
118
-
119
-
120
-
121
-
122
-
123
-
124
-
125
-
126
-
127
-
128
-
 129
129 -
 130
130 -
 131
131 -
 132
132 -
 133
133 -
 134
134 -
 135
135 -
 136
136 -
 137
137 -
 138
138 -
 139
139 -
 140
140 -
 141
141 -
 142
142 -
 143
143 -
 144
144 -
 145
145 -
 146
146 -
 147
147 -
 148
148 -
 149
149 -
150
-
151
-
152
-
153
-
154
-
155
-
156
-
157
-
158
-
159
-
160
-
161
-
162
-
163
-
164
-
165
-
166
-
167
-
168
-
169
-
170
-
171
-
172
-
173
-
174
-
175
-
176
-
177
-
178
-
179
-
180
-
181
-
182
-
183
-
184
-
185
-
186
-
187
-
188
-
189
-
190
-
191
-
192
-
193
-
194
-
195
-
196
-
197
-
198
-
199
-
200
-
201
-
202
-
203
-
204
-
205
-
206
-
207
-
208
-
209
-
210
-
211
-
212
-
213
-
214
-
215
-
216
-
217
-
218
-
219
-
220
-
221
-
222
-
223
-
224
-
225
-
226
-
227
-
228
-
229
-
230
-
231
-
232
-
233
-
234
-
235
-
236
-
237
-
238
-
239
-
240
-
241
-
242
-
243
-
244
-
245
-
246
-
247
-
248
-
249
-
250
-
251
-
252
-
253
-
254
-
255
-
256
-
257
-
258
-
259
-
260
-
261
-
262
-
263
-
264
-
265
-
266
-
267
-
268
 |
 |
Risk Characteristics of the Loan Portfolio
In order to assess the risk characteristics of the loan portfolio, Regions considers the current U.S. economic
environment and that of its primary banking markets, as well as risk factors within the major categories of loans.
Economic Environment in Regions’ Banking Markets
One of the primary factors influencing the credit performance of Regions’ loan portfolio is the overall
economic environment in the U.S. and the primary markets in which it operates. The Great Recession that began
in December 2007 continued through 2008 and into 2009. Through this recessionary period, the overall output of
goods and services experienced its sharpest decline since the early 1980s. Consumer spending, about 70 percent
of all recorded spending, has been adversely impacted by declining inflation-adjusted income, low additional
credit capacity, historically high required monthly debt payments, a negative employment outlook, a higher
savings portion of after-tax personal income, and historically low consumer confidence. However, business
sector output continues to grow, driven by replenishment of inventories that were highly depleted during the
recession.
In 2009, the economic downturn that began with the housing slowdown continued to negatively impact
consumer confidence. In turn, lower confidence levels negatively affected demand for goods and services. This
lower demand impacted retail sales and led to increased vacancy rates and lower rent rolls for the commercial
real estate sector. High unemployment continued in 2009 but began improving in 2010 and 2011. Residential real
estate prices were stable in 2010, but declined again in 2011. Concerns remain about the impact on real estate
prices from the future sale of the large supply of homes that are either on bank balance sheets or have mortgages
that are currently delinquent.
Late in 2010, significant fiscal and monetary stimuli were implemented. The Federal Reserve approved the
purchase of an additional $600 billion in U.S. Treasury bonds, and the Congress approved significant tax
provisions that were expected to increase consumption, and, thereby, Gross Domestic Product (“GDP”). Even
with these measures, the 1.7 percent growth in real GDP in 2011 trailed the 3.0 percent growth rate in 2010, as
the U.S was negatively impacted by the ongoing credit crisis in the Eurozone. Overall, the consensus for 2012 is
for marginally better but still below-trend economic growth. While the unemployment rate in the U.S declined
from 9.4 percent in December 2010 to 8.5 percent in December 2011, the rate has been 8.5 percent or greater for
34 consecutive months.
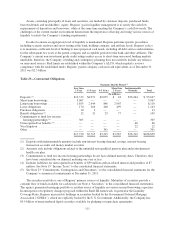
Portfolio Characteristics
Regions has a diversified loan portfolio, in terms of product type, collateral and geography. At
December 31, 2011, commercial loans represented 46 percent of total loans, net of unearned income, investor
real estate loans represented 14 percent, residential first mortgage loans totaled 18 percent and other consumer
loans, largely home equity lending, comprised the remaining 22 percent. Following is a discussion of risk
characteristics of each loan type.
Commercial—The commercial loan portfolio segment totaled $36.0 billion at year-end 2011 and primarily
consists of loans to small and mid-sized commercial and large corporate customers with business operations in
Regions’ geographic footprint. Loans in this portfolio are generally underwritten individually and are usually
secured with the assets of the company and/or the personal guarantee of the business owners. Also considered as
commercial loans are owner-occupied commercial real estate loans to businesses for long-term financing of land
and buildings. Regions attempts to minimize risk on owner-occupied properties by requiring collateral values
that exceed the loan amount, adequate cash flow to service the debt, and, in many cases, the personal guarantees
of principals of the borrowers. Net charge-offs on commercial loans were 1.40 percent in 2011 compared to 1.86
percent in 2010.
115