Regions Bank 2011 Annual Report Download - page 152
Download and view the complete annual report
Please find page 152 of the 2011 Regions Bank annual report below. You can navigate through the pages in the report by either clicking on the pages listed below, or by using the keyword search tool below to find specific information within the annual report.-
 1
1 -
2
-
3
-
4
-
5
-
6
-
7
-
8
-
9
-
10
-
11
-
12
-
13
-
14
-
15
-
16
-
17
-
18
-
19
-
20
-
21
-
22
-
23
-
24
-
25
-
26
-
27
-
28
-
29
-
30
-
31
-
32
-
33
-
34
-
35
-
36
-
37
-
38
-
39
-
40
-
41
-
42
-
43
-
44
-
45
-
46
-
47
-
48
-
49
-
50
-
51
-
52
-
53
-
54
-
55
-
56
-
57
-
58
-
59
-
60
-
61
-
62
-
63
-
64
-
65
-
66
-
67
-
68
-
69
-
70
-
71
-
72
-
73
-
74
-
75
-
76
-
77
-
78
-
79
-
80
-
81
-
82
-
83
-
84
-
85
-
86
-
87
-
88
-
89
-
90
-
91
-
92
-
93
-
94
-
95
-
96
-
97
-
98
-
99
-
100
-
101
-
102
-
103
-
104
-
105
-
106
-
107
-
108
-
109
-
110
-
111
-
112
-
113
-
114
-
115
-
116
-
117
-
118
-
119
-
120
-
121
-
122
-
123
-
124
-
125
-
126
-
127
-
128
-
129
-
130
-
131
-
132
-
133
-
134
-
135
-
136
-
137
-
138
-
139
-
140
-
141
-
 142
142 -
 143
143 -
 144
144 -
 145
145 -
 146
146 -
 147
147 -
 148
148 -
 149
149 -
 150
150 -
 151
151 -
 152
152 -
 153
153 -
 154
154 -
 155
155 -
 156
156 -
 157
157 -
 158
158 -
 159
159 -
 160
160 -
 161
161 -
 162
162 -
163
-
164
-
165
-
166
-
167
-
168
-
169
-
170
-
171
-
172
-
173
-
174
-
175
-
176
-
177
-
178
-
179
-
180
-
181
-
182
-
183
-
184
-
185
-
186
-
187
-
188
-
189
-
190
-
191
-
192
-
193
-
194
-
195
-
196
-
197
-
198
-
199
-
200
-
201
-
202
-
203
-
204
-
205
-
206
-
207
-
208
-
209
-
210
-
211
-
212
-
213
-
214
-
215
-
216
-
217
-
218
-
219
-
220
-
221
-
222
-
223
-
224
-
225
-
226
-
227
-
228
-
229
-
230
-
231
-
232
-
233
-
234
-
235
-
236
-
237
-
238
-
239
-
240
-
241
-
242
-
243
-
244
-
245
-
246
-
247
-
248
-
249
-
250
-
251
-
252
-
253
-
254
-
255
-
256
-
257
-
258
-
259
-
260
-
261
-
262
-
263
-
264
-
265
-
266
-
267
-
268
 |
 |

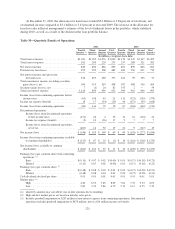
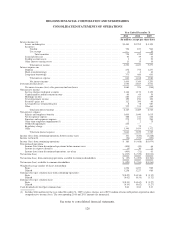
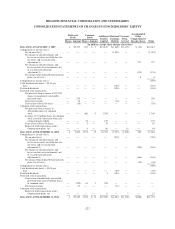
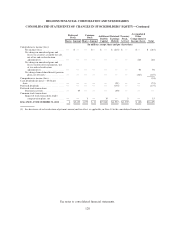
REGIONS FINANCIAL CORPORATION AND SUBSIDIARIES
CONSOLIDATED STATEMENTS OF CHANGES IN STOCKHOLDERS’ EQUITY—Continued
Preferred
Stock
Common
Stock Additional
Paid-In
Capital
Retained
Earnings
(Deficit)
Treasury
Stock,
At Cost
Accumulated
Other
Comprehensive
Income (Loss) TotalShares Amount Shares Amount
(In millions, except share and per share data)
Comprehensive income (loss):
Net income (loss) .................. — $ — — $— $ — $ (215) $ — $ — $ (215)
Net change in unrealized gains and
losses on securities available for sale,
net of tax and reclassification
adjustment(1) .................... — — — — — — — 244 244
Net change in unrealized gains and
losses on derivative instruments, net
of tax and reclassification
adjustment(1) .................... — — — — — — — 94 94
Net change from defined benefit pension
plans, net of tax(1) ................ — — — — — — — (147) (147)
Comprehensive income (loss) ............. (24)
Cash dividends declared — $0.04 per
share .............................. — — — — — (51) — — (51)
Preferred dividends ..................... — — — — — (175) — — (175)
Preferred stock transactions:
Discount accretion .................. — 39 — — — (39) — — —
Common stock transactions:
Impact of stock transactions under
compensation plans, net ........... — — 3 — 10 — 5 — 15
BALANCE AT DECEMBER 31, 2011 .... 4 $3,419 1,259 $ 13 $19,060 $(4,527) $(1,397) $ (69) $16,499
(1) See disclosure of reclassification adjustment amount and tax effect, as applicable, in Note 14 to the consolidated financial statements.
See notes to consolidated financial statements.
128