Regions Bank 2011 Annual Report Download - page 229
Download and view the complete annual report
Please find page 229 of the 2011 Regions Bank annual report below. You can navigate through the pages in the report by either clicking on the pages listed below, or by using the keyword search tool below to find specific information within the annual report.-
 1
1 -
2
-
3
-
4
-
5
-
6
-
7
-
8
-
9
-
10
-
11
-
12
-
13
-
14
-
15
-
16
-
17
-
18
-
19
-
20
-
21
-
22
-
23
-
24
-
25
-
26
-
27
-
28
-
29
-
30
-
31
-
32
-
33
-
34
-
35
-
36
-
37
-
38
-
39
-
40
-
41
-
42
-
43
-
44
-
45
-
46
-
47
-
48
-
49
-
50
-
51
-
52
-
53
-
54
-
55
-
56
-
57
-
58
-
59
-
60
-
61
-
62
-
63
-
64
-
65
-
66
-
67
-
68
-
69
-
70
-
71
-
72
-
73
-
74
-
75
-
76
-
77
-
78
-
79
-
80
-
81
-
82
-
83
-
84
-
85
-
86
-
87
-
88
-
89
-
90
-
91
-
92
-
93
-
94
-
95
-
96
-
97
-
98
-
99
-
100
-
101
-
102
-
103
-
104
-
105
-
106
-
107
-
108
-
109
-
110
-
111
-
112
-
113
-
114
-
115
-
116
-
117
-
118
-
119
-
120
-
121
-
122
-
123
-
124
-
125
-
126
-
127
-
128
-
129
-
130
-
131
-
132
-
133
-
134
-
135
-
136
-
137
-
138
-
139
-
140
-
141
-
142
-
143
-
144
-
145
-
146
-
147
-
148
-
149
-
150
-
151
-
152
-
153
-
154
-
155
-
156
-
157
-
158
-
159
-
160
-
161
-
162
-
163
-
164
-
165
-
166
-
167
-
168
-
169
-
170
-
171
-
172
-
173
-
174
-
175
-
176
-
177
-
178
-
179
-
180
-
181
-
182
-
183
-
184
-
185
-
186
-
187
-
188
-
189
-
190
-
191
-
192
-
193
-
194
-
195
-
196
-
197
-
198
-
199
-
200
-
201
-
202
-
203
-
204
-
205
-
206
-
207
-
208
-
209
-
210
-
211
-
212
-
213
-
214
-
215
-
216
-
217
-
218
-
 219
219 -
 220
220 -
 221
221 -
 222
222 -
 223
223 -
 224
224 -
 225
225 -
 226
226 -
 227
227 -
 228
228 -
 229
229 -
 230
230 -
 231
231 -
 232
232 -
 233
233 -
 234
234 -
 235
235 -
 236
236 -
 237
237 -
 238
238 -
 239
239 -
240
-
241
-
242
-
243
-
244
-
245
-
246
-
247
-
248
-
249
-
250
-
251
-
252
-
253
-
254
-
255
-
256
-
257
-
258
-
259
-
260
-
261
-
262
-
263
-
264
-
265
-
266
-
267
-
268
 |
 |

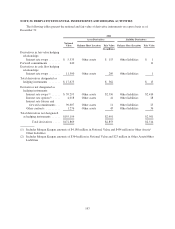
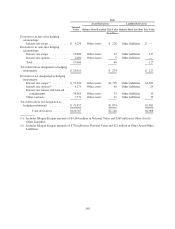
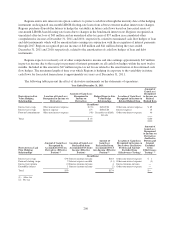
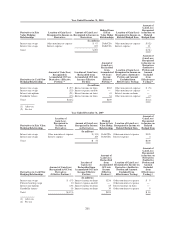
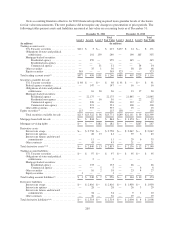
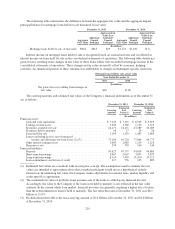
New accounting literature effective for 2010 financial reporting required more granular levels of disclosure
for fair value measurements. The new guidance did not require any changes to presentation of prior periods. The
following tables present assets and liabilities measured at fair value on a recurring basis as of December 31:
December 31, 2011 December 31, 2010
Level 1 Level 2 Level 3
Total
Fair Value Level 1 Level 2 Level 3
Total
Fair Value
(In millions) (In millions)
Trading account assets .......................
U.S. Treasury securities .................. $212 $ 3 $— $ 215 $157 $ 14 $— $ 171
Obligations of states and political
subdivisions ......................... — 101 139 240 — 190 165 355
Mortgage-backed securities:
Residential agency .................. — 359 — 359 — 145 — 145
Residential non-agency .............. — — — — — — — —
Commercial agency ................. — — 51 51 — — 54 54
Other securities ........................ — 35 1 36 — 58 10 68
Equity securities ....................... 365 — — 365 323 — — 323
Total trading account assets(1) ................. $577 $ 498 $191 $ 1,266 $480 $ 407 $229 $ 1,116
Securities available for sale ...................
U.S. Treasury securities .................. $ 98 $ — $— $ 98 $ 91 $ — $— $ 91
Federal agency securities ................. — 147 — 147 — 16 — 16
Obligations of states and political
subdivisions ......................... — 16 20 36 — 13 17 30
Mortgage-backed securities:
Residential agency .................. — 22,175 — 22,175 — 21,845 — 21,845
Residential non-agency .............. — — 16 16 — — 22 22
Commercial agency ................. — 326 — 326 — 112 — 112
Commercial non-agency ............. — 321 — 321 — 100 — 100
Other debt securities .................... — 537 — 537 — 25 — 25
Equity securities(2) .......................... 115 — — 115 158 — — 158
Total securities available for sale .......... $213 $23,522 $ 36 $23,771 $249 $22,111 $ 39 $22,399
Mortgage loans held for sale .................. $— $ 844 $— $ 844 $— $ 1,174 $— $ 1,174
Mortgage servicing rights .................... $— $ — $182 $ 182 $— $ — $267 $ 267
Derivative assets
Interest rate swaps ...................... $— $ 2,758 $— $ 2,758 $— $ 2,047 $— $ 2,047
Interest rate options ..................... — 28 13 41 — 39 6 45
Interest rate futures and forward
commitments ........................ — 11 — 11 — 29 6 35
Other contracts ........................ — 43 — 43 — 21 — 21
Total derivative assets(3)(4) .................... $— $ 2,840 $ 13 $ 2,853 $— $ 2,136 $ 12 $ 2,148
Trading account liabilities ....................
U.S. Treasury securities .................. $— $ 97 $— $ 97 $— $ 95 $— $ 95
Obligations of states and political
subdivisions ......................... — 2 — 2 — — — —
Mortgage-backed securities:
Residential agency .................. — 133 — 133 — 46 — 46
Commercial agency ................. — — 5 5 — — 6 6
Other securities ........................ — 16 2 18 — 23 4 27
Equity securities ....................... 1 — — 1 — — — —
Total trading account liabilities(5) .............. $ 1 $ 248 $ 7 $ 256 $— $ 164 $ 10 $ 174
Derivative liabilities ........................
Interest rate swaps ...................... $— $ 2,416 $— $ 2,416 $— $ 1,950 $— $ 1,950
Interest rate options ..................... — 28 — 28 — 26 3 29
Interest rate futures and forward
commitments ........................ — 34 — 34 — 9 1 10
Other contracts ........................ — 36 — 36 — 19 — 19
Total derivative liabilities(3)(4) ................. $— $ 2,514 $— $ 2,514 $— $ 2,004 $ 4 $ 2,008
205