Regions Bank 2011 Annual Report Download - page 202
Download and view the complete annual report
Please find page 202 of the 2011 Regions Bank annual report below. You can navigate through the pages in the report by either clicking on the pages listed below, or by using the keyword search tool below to find specific information within the annual report.-
 1
1 -
2
-
3
-
4
-
5
-
6
-
7
-
8
-
9
-
10
-
11
-
12
-
13
-
14
-
15
-
16
-
17
-
18
-
19
-
20
-
21
-
22
-
23
-
24
-
25
-
26
-
27
-
28
-
29
-
30
-
31
-
32
-
33
-
34
-
35
-
36
-
37
-
38
-
39
-
40
-
41
-
42
-
43
-
44
-
45
-
46
-
47
-
48
-
49
-
50
-
51
-
52
-
53
-
54
-
55
-
56
-
57
-
58
-
59
-
60
-
61
-
62
-
63
-
64
-
65
-
66
-
67
-
68
-
69
-
70
-
71
-
72
-
73
-
74
-
75
-
76
-
77
-
78
-
79
-
80
-
81
-
82
-
83
-
84
-
85
-
86
-
87
-
88
-
89
-
90
-
91
-
92
-
93
-
94
-
95
-
96
-
97
-
98
-
99
-
100
-
101
-
102
-
103
-
104
-
105
-
106
-
107
-
108
-
109
-
110
-
111
-
112
-
113
-
114
-
115
-
116
-
117
-
118
-
119
-
120
-
121
-
122
-
123
-
124
-
125
-
126
-
127
-
128
-
129
-
130
-
131
-
132
-
133
-
134
-
135
-
136
-
137
-
138
-
139
-
140
-
141
-
142
-
143
-
144
-
145
-
146
-
147
-
148
-
149
-
150
-
151
-
152
-
153
-
154
-
155
-
156
-
157
-
158
-
159
-
160
-
161
-
162
-
163
-
164
-
165
-
166
-
167
-
168
-
169
-
170
-
171
-
172
-
173
-
174
-
175
-
176
-
177
-
178
-
179
-
180
-
181
-
182
-
183
-
184
-
185
-
186
-
187
-
188
-
189
-
190
-
191
-
 192
192 -
 193
193 -
 194
194 -
 195
195 -
 196
196 -
 197
197 -
 198
198 -
 199
199 -
 200
200 -
 201
201 -
 202
202 -
 203
203 -
 204
204 -
 205
205 -
 206
206 -
 207
207 -
 208
208 -
 209
209 -
 210
210 -
 211
211 -
 212
212 -
213
-
214
-
215
-
216
-
217
-
218
-
219
-
220
-
221
-
222
-
223
-
224
-
225
-
226
-
227
-
228
-
229
-
230
-
231
-
232
-
233
-
234
-
235
-
236
-
237
-
238
-
239
-
240
-
241
-
242
-
243
-
244
-
245
-
246
-
247
-
248
-
249
-
250
-
251
-
252
-
253
-
254
-
255
-
256
-
257
-
258
-
259
-
260
-
261
-
262
-
263
-
264
-
265
-
266
-
267
-
268
 |
 |

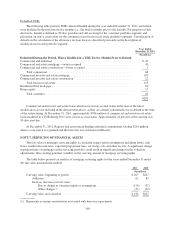
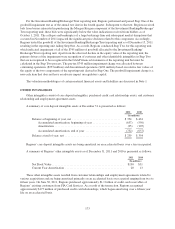
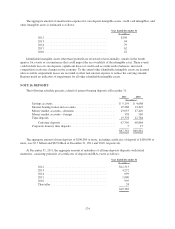
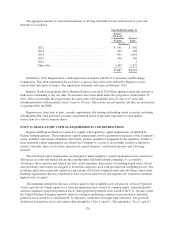
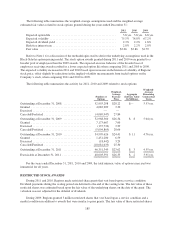
The aggregate amount of contractual maturities of all long-term debt in each of the next five years and
thereafter is as follows:
Year Ended December 31
Regions
Financial
Corporation
(Parent)
Regions
Bank
(In millions)
2012 .......................................... $ 951 $ 902
2013 .......................................... 250 498
2014 .......................................... 695 1,001
2015 .......................................... 496 348
2016 .......................................... — 2
Thereafter ...................................... 1,495 1,472
$3,887 $4,223
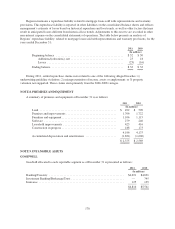
In February 2010, Regions filed a shelf registration statement with the U.S. Securities and Exchange
Commission. This shelf registration does not have a capacity limit and can be utilized by Regions to issue
various debt and equity securities. The registration statement will expire in February 2013.
Regions’ Bank Note program allows Regions Bank to issue up to $20 billion aggregate principal amount of
bank notes outstanding at any one time. No issuances have been made under this program as of December 31,
2011. Notes issued under the program may be senior notes with maturities from 30 days to 15 years and
subordinated notes with maturities from 5 years to 30 years. These notes are not deposits and they are not insured
or guaranteed by the FDIC.
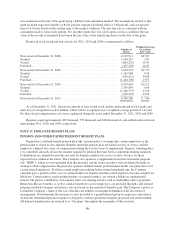
Regions may, from time to time, consider opportunistically retiring outstanding issued securities, including
subordinated debt, trust preferred securities and preferred shares in privately negotiated or open market
transactions for cash or common shares.
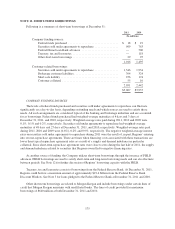
NOTE 13. REGULATORY CAPITAL REQUIREMENTS AND RESTRICTIONS
Regions and Regions Bank are required to comply with regulatory capital requirements established by
Federal banking agencies. These regulatory capital requirements involve quantitative measures of the Company’s
assets, liabilities and certain off-balance sheet items, and also qualitative judgments by the regulators. Failure to
meet minimum capital requirements can subject the Company to a series of increasingly restrictive regulatory
actions. Currently, there are two basic measures of capital adequacy: a risk-based measure and a leverage
measure.
The risk-based capital requirements are designed to make regulatory capital requirements more sensitive to
differences in credit and market risk profiles among banks and bank holding companies, to account for
off-balance sheet exposure and interest rate risk, and to minimize disincentives for holding liquid assets. Assets
and off-balance sheet items are assigned to broad risk categories, each with specified risk-weighting factors. The
resulting capital ratios represent capital as a percentage of total risk-weighted assets and off-balance sheet items.
Banking organizations that are considered to have excessive interest rate risk exposure are required to maintain
higher levels of capital.
The minimum standard for the ratio of total capital to risk-weighted assets is 8 percent. At least 50 percent
of that capital level (which equates to a 4 percent minimum) must consist of common equity, undivided profits
and non-cumulative perpetual preferred stock, senior perpetual preferred stock issued to the U.S. Treasury under
the Capital Purchase Program, minority interests relating to qualifying common or noncumulative perpetual
preferred stock issued by a consolidated U.S. depository institution or foreign bank subsidiary, less goodwill,
disallowed deferred tax assets and certain other intangibles (“Tier 1 capital”). The remainder (“Tier 2 capital”)
178