Regions Bank 2011 Annual Report Download - page 213
Download and view the complete annual report
Please find page 213 of the 2011 Regions Bank annual report below. You can navigate through the pages in the report by either clicking on the pages listed below, or by using the keyword search tool below to find specific information within the annual report.-
 1
1 -
2
-
3
-
4
-
5
-
6
-
7
-
8
-
9
-
10
-
11
-
12
-
13
-
14
-
15
-
16
-
17
-
18
-
19
-
20
-
21
-
22
-
23
-
24
-
25
-
26
-
27
-
28
-
29
-
30
-
31
-
32
-
33
-
34
-
35
-
36
-
37
-
38
-
39
-
40
-
41
-
42
-
43
-
44
-
45
-
46
-
47
-
48
-
49
-
50
-
51
-
52
-
53
-
54
-
55
-
56
-
57
-
58
-
59
-
60
-
61
-
62
-
63
-
64
-
65
-
66
-
67
-
68
-
69
-
70
-
71
-
72
-
73
-
74
-
75
-
76
-
77
-
78
-
79
-
80
-
81
-
82
-
83
-
84
-
85
-
86
-
87
-
88
-
89
-
90
-
91
-
92
-
93
-
94
-
95
-
96
-
97
-
98
-
99
-
100
-
101
-
102
-
103
-
104
-
105
-
106
-
107
-
108
-
109
-
110
-
111
-
112
-
113
-
114
-
115
-
116
-
117
-
118
-
119
-
120
-
121
-
122
-
123
-
124
-
125
-
126
-
127
-
128
-
129
-
130
-
131
-
132
-
133
-
134
-
135
-
136
-
137
-
138
-
139
-
140
-
141
-
142
-
143
-
144
-
145
-
146
-
147
-
148
-
149
-
150
-
151
-
152
-
153
-
154
-
155
-
156
-
157
-
158
-
159
-
160
-
161
-
162
-
163
-
164
-
165
-
166
-
167
-
168
-
169
-
170
-
171
-
172
-
173
-
174
-
175
-
176
-
177
-
178
-
179
-
180
-
181
-
182
-
183
-
184
-
185
-
186
-
187
-
188
-
189
-
190
-
191
-
192
-
193
-
194
-
195
-
196
-
197
-
198
-
199
-
200
-
201
-
202
-
 203
203 -
 204
204 -
 205
205 -
 206
206 -
 207
207 -
 208
208 -
 209
209 -
 210
210 -
 211
211 -
 212
212 -
 213
213 -
 214
214 -
 215
215 -
 216
216 -
 217
217 -
 218
218 -
 219
219 -
 220
220 -
 221
221 -
 222
222 -
 223
223 -
224
-
225
-
226
-
227
-
228
-
229
-
230
-
231
-
232
-
233
-
234
-
235
-
236
-
237
-
238
-
239
-
240
-
241
-
242
-
243
-
244
-
245
-
246
-
247
-
248
-
249
-
250
-
251
-
252
-
253
-
254
-
255
-
256
-
257
-
258
-
259
-
260
-
261
-
262
-
263
-
264
-
265
-
266
-
267
-
268
 |
 |

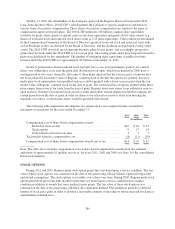
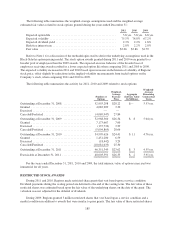
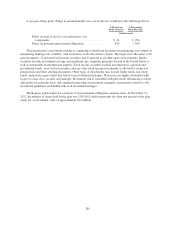
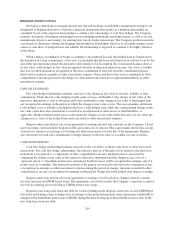
A one-percentage point change in assumed health care cost trend rates would have the following effects:
1-Percentage
Point Increase
1-Percentage
Point Decrease
(In thousands)
Effect on total of service cost and interest cost
components ..................................... $ 34 $ (30)
Effect on postretirement benefit obligations .............. 830 (743)
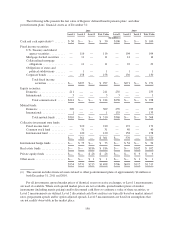
The pension plan’s investment strategy is continuing to shift from focusing on maximizing asset returns to
minimizing funding ratio volatility, with an increase to the allocation to bonds. The target asset allocation is 46
percent equities, 32 percent fixed income securities and 22 percent in all other types of investments. Equity
securities include investments in large and small/mid cap companies primarily located in the United States as
well as investments in international equities. Fixed income securities include investments in corporate and
government bonds, asset-backed securities and any other fixed income investments as allowed by respective
prospectuses and other offering documents. Other types of investments may include hedge funds, real estate
funds, and private equity funds that follow several different strategies. Plan assets are highly diversified with
respect to asset class, security and manager. Investment risk is controlled with plan assets rebalancing to target
allocations on a periodic basis and continual monitoring of investment managers’ performance relative to the
investment guidelines established with each investment manager.
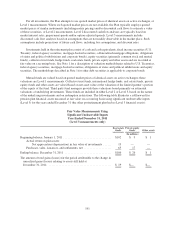
The Regions pension plan has a portion of its investments in Regions common stock. At December 31,
2011, the number of shares held by the plan was 2,855,618, which represents less than one percent of the plan
assets for a total market value of approximately $12 million.
189