Regions Bank 2011 Annual Report Download - page 184
Download and view the complete annual report
Please find page 184 of the 2011 Regions Bank annual report below. You can navigate through the pages in the report by either clicking on the pages listed below, or by using the keyword search tool below to find specific information within the annual report.-
 1
1 -
2
-
3
-
4
-
5
-
6
-
7
-
8
-
9
-
10
-
11
-
12
-
13
-
14
-
15
-
16
-
17
-
18
-
19
-
20
-
21
-
22
-
23
-
24
-
25
-
26
-
27
-
28
-
29
-
30
-
31
-
32
-
33
-
34
-
35
-
36
-
37
-
38
-
39
-
40
-
41
-
42
-
43
-
44
-
45
-
46
-
47
-
48
-
49
-
50
-
51
-
52
-
53
-
54
-
55
-
56
-
57
-
58
-
59
-
60
-
61
-
62
-
63
-
64
-
65
-
66
-
67
-
68
-
69
-
70
-
71
-
72
-
73
-
74
-
75
-
76
-
77
-
78
-
79
-
80
-
81
-
82
-
83
-
84
-
85
-
86
-
87
-
88
-
89
-
90
-
91
-
92
-
93
-
94
-
95
-
96
-
97
-
98
-
99
-
100
-
101
-
102
-
103
-
104
-
105
-
106
-
107
-
108
-
109
-
110
-
111
-
112
-
113
-
114
-
115
-
116
-
117
-
118
-
119
-
120
-
121
-
122
-
123
-
124
-
125
-
126
-
127
-
128
-
129
-
130
-
131
-
132
-
133
-
134
-
135
-
136
-
137
-
138
-
139
-
140
-
141
-
142
-
143
-
144
-
145
-
146
-
147
-
148
-
149
-
150
-
151
-
152
-
153
-
154
-
155
-
156
-
157
-
158
-
159
-
160
-
161
-
162
-
163
-
164
-
165
-
166
-
167
-
168
-
169
-
170
-
171
-
172
-
173
-
 174
174 -
 175
175 -
 176
176 -
 177
177 -
 178
178 -
 179
179 -
 180
180 -
 181
181 -
 182
182 -
 183
183 -
 184
184 -
 185
185 -
 186
186 -
 187
187 -
 188
188 -
 189
189 -
 190
190 -
 191
191 -
 192
192 -
 193
193 -
 194
194 -
195
-
196
-
197
-
198
-
199
-
200
-
201
-
202
-
203
-
204
-
205
-
206
-
207
-
208
-
209
-
210
-
211
-
212
-
213
-
214
-
215
-
216
-
217
-
218
-
219
-
220
-
221
-
222
-
223
-
224
-
225
-
226
-
227
-
228
-
229
-
230
-
231
-
232
-
233
-
234
-
235
-
236
-
237
-
238
-
239
-
240
-
241
-
242
-
243
-
244
-
245
-
246
-
247
-
248
-
249
-
250
-
251
-
252
-
253
-
254
-
255
-
256
-
257
-
258
-
259
-
260
-
261
-
262
-
263
-
264
-
265
-
266
-
267
-
268
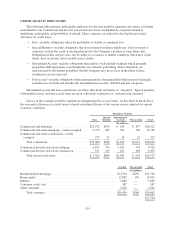
 |
 |

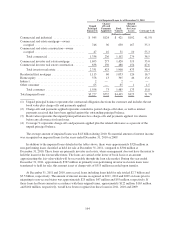
December 31, 2010
Pass
Special
Mention
Substandard
Accrual Non-accrual Total
(In millions)
Commercial and industrial ....................... $20,764 $ 517 $ 792 $ 467 $22,540
Commercial real estate mortgage—owner occupied . . . 10,344 283 813 606 12,046
Commercial real estate construction—owner
occupied ................................... 393 25 23 29 470
Total commercial .......................... $31,501 $ 825 $1,628 $1,102 $35,056
Commerical investor real estate mortgage ........... 8,755 1,300 2,301 1,265 13,621
Commercial investor real estate construction ......... 904 342 589 452 2,287
Total investor real estate ..................... $ 9,659 $1,642 $2,890 $1,717 $15,908
Accrual Non-accrual Total
(In millions)
Residential first mortgage .......................................... $14,613 $285 $14,898
Home equity ..................................................... 14,170 56 14,226
Indirect ......................................................... 1,592 — 1,592
Other consumer .................................................. 1,184 — 1,184
Total consumer ............................................... $31,559 $341 $31,900
$82,864
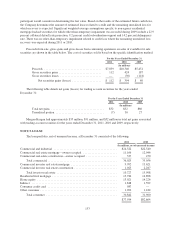
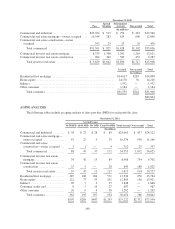
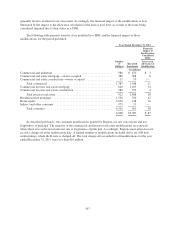
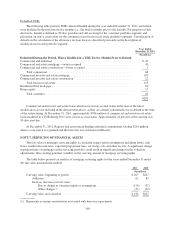
AGING ANALYSIS
The following tables include an aging analysis of days past due (DPD) for each portfolio class:
December 31, 2011
Accrual Loans
30-59 DPD 60-89 DPD 90+ DPD Total 30+ DPD Total Accrual Non-accrual Total
(In millions)
Commercial and industrial ........ $ 38 $ 23 $ 28 $ 89 $24,065 $ 457 $24,522
Commercial real estate mortgage—
owner occupied ............... 47 23 9 79 10,576 590 11,166
Commercial real estate
construction—owner occupied . . . 3 1 — 4 312 25 337
Total commercial ........... 88 47 37 172 34,953 1,072 36,025
Commercial investor real estate
mortgage .................... 34 42 13 89 8,968 734 9,702
Commercial investor real estate
construction ................. 23 5 — 28 845 180 1,025
Total investor real estate ...... 57 47 13 117 9,813 914 10,727
Residential first mortgage ......... 187 100 284 571 13,534 250 13,784
Home equity ................... 121 77 93 291 12,885 136 13,021
Indirect ....................... 26 7 2 35 1,848 — 1,848
Consumer credit card ............ 8 5 14 27 987 — 987
Other consumer ................. 20 6 4 30 1,202 — 1,202
Total consumer ............. 362 195 397 954 30,456 386 30,842
$507 $289 $447 $1,243 $75,222 $2,372 $77,594
160