Regions Bank 2011 Annual Report Download - page 199
Download and view the complete annual report
Please find page 199 of the 2011 Regions Bank annual report below. You can navigate through the pages in the report by either clicking on the pages listed below, or by using the keyword search tool below to find specific information within the annual report.-
 1
1 -
2
-
3
-
4
-
5
-
6
-
7
-
8
-
9
-
10
-
11
-
12
-
13
-
14
-
15
-
16
-
17
-
18
-
19
-
20
-
21
-
22
-
23
-
24
-
25
-
26
-
27
-
28
-
29
-
30
-
31
-
32
-
33
-
34
-
35
-
36
-
37
-
38
-
39
-
40
-
41
-
42
-
43
-
44
-
45
-
46
-
47
-
48
-
49
-
50
-
51
-
52
-
53
-
54
-
55
-
56
-
57
-
58
-
59
-
60
-
61
-
62
-
63
-
64
-
65
-
66
-
67
-
68
-
69
-
70
-
71
-
72
-
73
-
74
-
75
-
76
-
77
-
78
-
79
-
80
-
81
-
82
-
83
-
84
-
85
-
86
-
87
-
88
-
89
-
90
-
91
-
92
-
93
-
94
-
95
-
96
-
97
-
98
-
99
-
100
-
101
-
102
-
103
-
104
-
105
-
106
-
107
-
108
-
109
-
110
-
111
-
112
-
113
-
114
-
115
-
116
-
117
-
118
-
119
-
120
-
121
-
122
-
123
-
124
-
125
-
126
-
127
-
128
-
129
-
130
-
131
-
132
-
133
-
134
-
135
-
136
-
137
-
138
-
139
-
140
-
141
-
142
-
143
-
144
-
145
-
146
-
147
-
148
-
149
-
150
-
151
-
152
-
153
-
154
-
155
-
156
-
157
-
158
-
159
-
160
-
161
-
162
-
163
-
164
-
165
-
166
-
167
-
168
-
169
-
170
-
171
-
172
-
173
-
174
-
175
-
176
-
177
-
178
-
179
-
180
-
181
-
182
-
183
-
184
-
185
-
186
-
187
-
188
-
 189
189 -
 190
190 -
 191
191 -
 192
192 -
 193
193 -
 194
194 -
 195
195 -
 196
196 -
 197
197 -
 198
198 -
 199
199 -
 200
200 -
 201
201 -
 202
202 -
 203
203 -
 204
204 -
 205
205 -
 206
206 -
 207
207 -
 208
208 -
 209
209 -
210
-
211
-
212
-
213
-
214
-
215
-
216
-
217
-
218
-
219
-
220
-
221
-
222
-
223
-
224
-
225
-
226
-
227
-
228
-
229
-
230
-
231
-
232
-
233
-
234
-
235
-
236
-
237
-
238
-
239
-
240
-
241
-
242
-
243
-
244
-
245
-
246
-
247
-
248
-
249
-
250
-
251
-
252
-
253
-
254
-
255
-
256
-
257
-
258
-
259
-
260
-
261
-
262
-
263
-
264
-
265
-
266
-
267
-
268
 |
 |

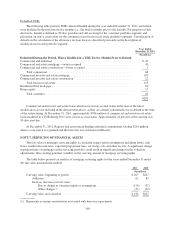
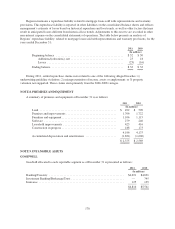
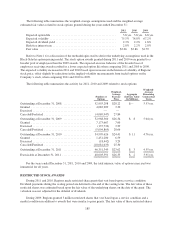
NOTE 11. SHORT-TERM BORROWINGS
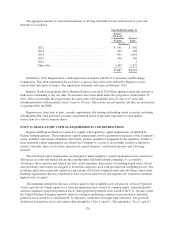
Following is a summary of short-term borrowings at December 31:
2011 2010
(In millions)
Company funding sources:
Federal funds purchased .................................. $ 18 $ 19
Securities sold under agreements to repurchase ................ 969 763
Federal Home Loan Bank advances ......................... — 500
Treasury, tax and loan notes ............................... — 118
Other short-term borrowings ............................... 29 95
1,016 1,495
Customer-related borrowings:
Securities sold under agreements to repurchase ................ 1,346 1,934
Brokerage customer liabilities .............................. 394 324
Short-sale liability ....................................... 256 174
Customer collateral ...................................... 55 10
2,051 2,442
$3,067 $3,937
COMPANY FUNDING SOURCES
The levels of federal funds purchased and securities sold under agreements to repurchase can fluctuate
significantly on a day-to-day basis, depending on funding needs and which sources are used to satisfy those
needs. All such arrangements are considered typical of the banking and brokerage industries and are accounted
for as borrowings. Federal funds purchased had weighted-average maturities of 4 days and 3 days at
December 31, 2011, and 2010, respectively. Weighted-average rates paid during 2011, 2010 and 2009 were
0.1%, 0.1% and 0.2%, respectively. Securities sold under agreements to repurchase had weighted-average
maturities of 48 days and 27 days at December 31, 2011, and 2010, respectively. Weighted-average rates paid
during 2011, 2010 and 2009 were (0.6%), 0.2% and 0.9%, respectively. The negative weighted-average interest
rates on securities sold under agreements to repurchase during 2011 were the result of, in part, Regions’ entering
into reverse-repurchase agreements. There are times when financing costs associated with these transactions are
lower than typical repurchase agreement rates as a result of a supply and demand imbalance in particular
collateral. Since short-term repurchase agreement rates were close to zero during the last half of 2011, the supply
and demand imbalance related to securities that Regions owned led to negative financing rates.
As another source of funding, the Company utilizes short-term borrowings through the issuance of FHLB
advances. FHLB borrowings are used to satisfy short-term and long-term borrowing needs and can also fluctuate
between periods. See Note 12 for further discussion of Regions’ borrowing capacity with the FHLB.
Treasury, tax and loan notes consist of borrowings from the Federal Reserve Bank. At December 31, 2011,
Regions could borrow a maximum amount of approximately $19.4 billion from the Federal Reserve Bank
Discount Window. See Note 5 for loans pledged to the Federal Reserve Bank at December 31, 2011 and 2010.
Other short-term borrowings are related to Morgan Keegan and include borrowings under certain lines of
credit that Morgan Keegan maintains with unaffiliated banks. The lines of credit provided for maximum
borrowings of $640 million at both December 31, 2011 and 2010.
175