Regions Bank 2011 Annual Report Download - page 217
Download and view the complete annual report
Please find page 217 of the 2011 Regions Bank annual report below. You can navigate through the pages in the report by either clicking on the pages listed below, or by using the keyword search tool below to find specific information within the annual report.-
 1
1 -
2
-
3
-
4
-
5
-
6
-
7
-
8
-
9
-
10
-
11
-
12
-
13
-
14
-
15
-
16
-
17
-
18
-
19
-
20
-
21
-
22
-
23
-
24
-
25
-
26
-
27
-
28
-
29
-
30
-
31
-
32
-
33
-
34
-
35
-
36
-
37
-
38
-
39
-
40
-
41
-
42
-
43
-
44
-
45
-
46
-
47
-
48
-
49
-
50
-
51
-
52
-
53
-
54
-
55
-
56
-
57
-
58
-
59
-
60
-
61
-
62
-
63
-
64
-
65
-
66
-
67
-
68
-
69
-
70
-
71
-
72
-
73
-
74
-
75
-
76
-
77
-
78
-
79
-
80
-
81
-
82
-
83
-
84
-
85
-
86
-
87
-
88
-
89
-
90
-
91
-
92
-
93
-
94
-
95
-
96
-
97
-
98
-
99
-
100
-
101
-
102
-
103
-
104
-
105
-
106
-
107
-
108
-
109
-
110
-
111
-
112
-
113
-
114
-
115
-
116
-
117
-
118
-
119
-
120
-
121
-
122
-
123
-
124
-
125
-
126
-
127
-
128
-
129
-
130
-
131
-
132
-
133
-
134
-
135
-
136
-
137
-
138
-
139
-
140
-
141
-
142
-
143
-
144
-
145
-
146
-
147
-
148
-
149
-
150
-
151
-
152
-
153
-
154
-
155
-
156
-
157
-
158
-
159
-
160
-
161
-
162
-
163
-
164
-
165
-
166
-
167
-
168
-
169
-
170
-
171
-
172
-
173
-
174
-
175
-
176
-
177
-
178
-
179
-
180
-
181
-
182
-
183
-
184
-
185
-
186
-
187
-
188
-
189
-
190
-
191
-
192
-
193
-
194
-
195
-
196
-
197
-
198
-
199
-
200
-
201
-
202
-
203
-
204
-
205
-
206
-
 207
207 -
 208
208 -
 209
209 -
 210
210 -
 211
211 -
 212
212 -
 213
213 -
 214
214 -
 215
215 -
 216
216 -
 217
217 -
 218
218 -
 219
219 -
 220
220 -
 221
221 -
 222
222 -
 223
223 -
 224
224 -
 225
225 -
 226
226 -
 227
227 -
228
-
229
-
230
-
231
-
232
-
233
-
234
-
235
-
236
-
237
-
238
-
239
-
240
-
241
-
242
-
243
-
244
-
245
-
246
-
247
-
248
-
249
-
250
-
251
-
252
-
253
-
254
-
255
-
256
-
257
-
258
-
259
-
260
-
261
-
262
-
263
-
264
-
265
-
266
-
267
-
268
 |
 |

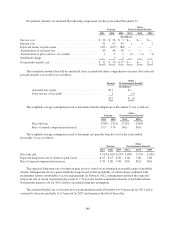
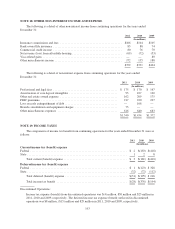
NOTE 18. OTHER NON-INTEREST INCOME AND EXPENSE
The following is a detail of other non-interest income from continuing operations for the years ended
December 31:
2011 2010 2009
(In millions)
Insurance commissions and fees .......................................... $106 $104 $105
Bank-owned life insurance ............................................... 83 88 74
Commercial credit income ............................................... 80 76 70
Net revenue (loss) from affordable housing .................................. (69) (72) (53)
Visa-related gains ...................................................... — — 80
Other miscellaneous income .............................................. 172 135 188
$372 $331 $464
The following is a detail of non-interest expense from continuing operations for the years ended
December 31:
2011 2010 2009
(In millions)
Professional and legal fees ............................................ $ 175 $ 170 $ 167
Amortization of core deposit intangibles ................................. 95 107 120
Other real estate owned expense ....................................... 162 209 175
FDIC premiums .................................................... 217 220 227
Loss on early extinguishment of debt .................................... — 108 —
Branch consolidation and equipment charges ............................. 75 — —
Other miscellaneous expenses ......................................... 616 640 683
$1,340 $1,454 $1,372
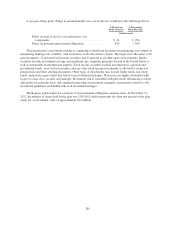
NOTE 19. INCOME TAXES
The components of income tax benefit from continuing operations for the years ended December 31 were as
follows:
2011 2010 2009
(In millions)
Current income tax (benefit) expense
Federal .................................................................. $ 2 $(183) $(418)
State .................................................................... 1 2 8
Total current (benefit) expense ........................................... $ 3 $(181) $(410)
Deferred income tax (benefit) expense
Federal .................................................................. $ 1 $(123) $ 328
State .................................................................... (32) (72) (112)
Total deferred (benefit) expense .......................................... $(31) $(195) $ 216
Total income tax benefit ................................................ $(28) $(376) $(194)
Discontinued Operations:
Income tax expense (benefit) from discontinued operations was $(4) million, $30 million and $23 million in
2011, 2010 and 2009, respectively. The deferred income tax expense (benefit) reflected in discontinued
operations was $8 million, ($15) million and $29 million in 2011, 2010 and 2009, respectively.
193